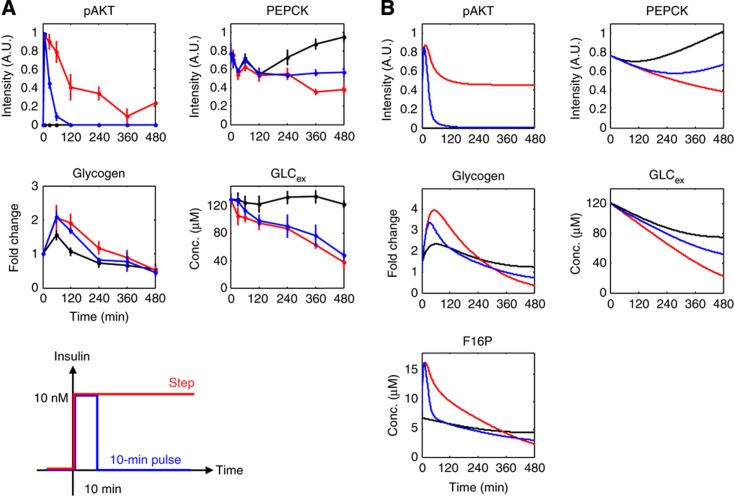
Figure 3.
The effect of insulin pulse stimulation on glucose metabolism. (A) Time courses of pAKT, F16P, PEPCK, glycogen and GLCex in response to a 10-min pulse stimulation (blue), a step stimulation (red) and 0 nM (black) of insulin in FAO cells. The mean values and SEMs of three independent experiments are shown. The doses and duration of the insulin stimulations are shown at the bottom. (B) Time courses of pAKT, PEPCK, glycogen, GLCex and F16P in response to a 10-min pulse stimulation of the insulin-dependent glucose metabolism model. Source data for this figure is available on the online supplementary information page.

