Figure 1.
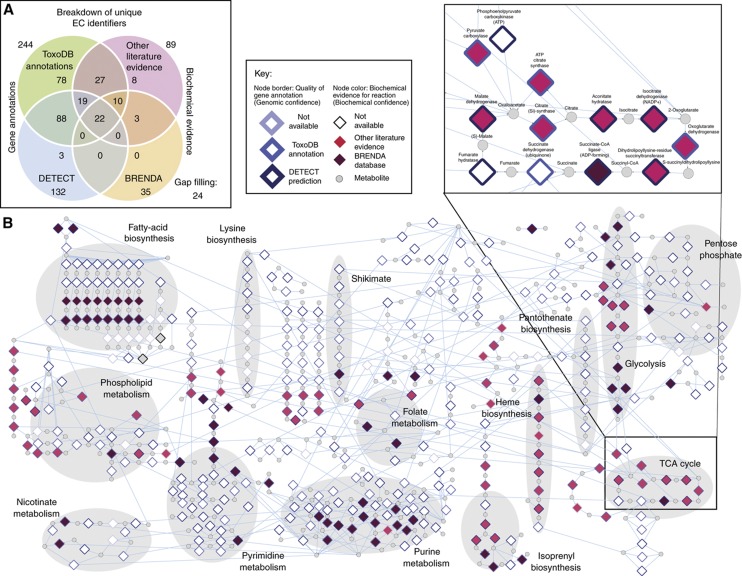
Overview of iCS382. (A) Evidence associated with reactions included in the metabolic reconstruction of T. gondii (iCS382), broken down by source of reaction evidence. Numbers in bold indicate the total number of reactions supported in iCS382 by the specific resource. (B) Bipartite network representation of iCS382 in which nodes represent either reactions (diamonds) or metabolites (circles). Edges between nodes represent enzyme–substrate relationships. Shaded backgrounds indicate groups of enzymes organized into pathways as defined by the Kyoto Encyclopedia of Genes and Genomes (KEGG—Kanehisa et al, 2006). A close-up of the TCA cycle showing details of names of enzymes and substrates is also shown as an inset. Reaction nodes are colored according to evidence for gene annotation as well as biochemical data (see inset key). Visualization of the network was performed using Cytoscape (Shannon et al, 2003). Edges to common currency metabolites have been removed for clarity.

