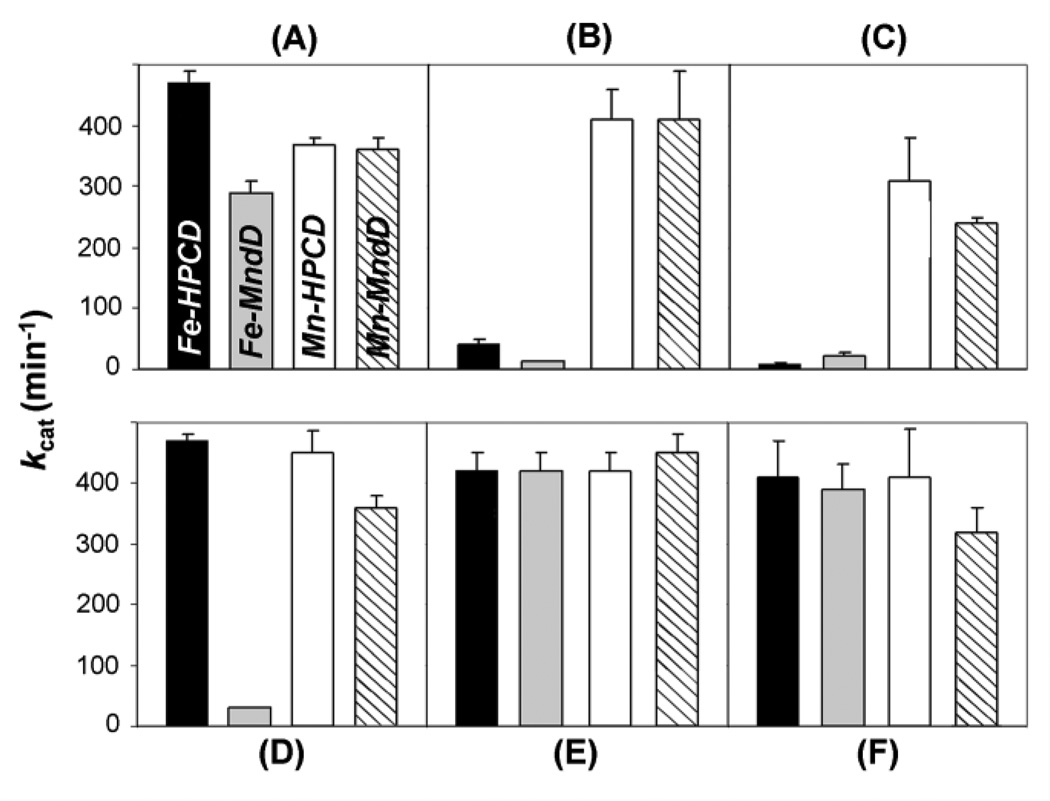
Fig. 2.
Activation and inhibition of HPCD and MndD activity in 50 mM MOPS pH 7.8. The average activity for each enzyme is displayed as one bar within each panel. (A) Activities of as-isolated enzymes. (B and C) Data collected after the enzymes were treated with 1 mM H2O2 or K3Fe(CN)6, respectively. (D) Activities of the as-isolated enzymes after exposure to air for 1 hr. (E and F) Activity after treatment of the air-exposed enzymes in D with 1 mM sodium ascorbate and or K4Fe(CN)6, respectively. Reproduced from ref. [8] with permission.

