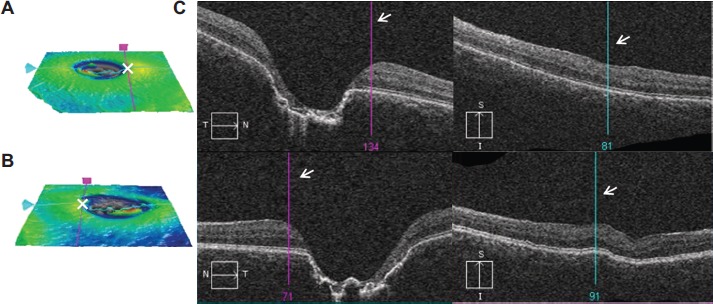
Figure 3.

SD-OCT images at age 4 years and 1 month.
Notes: (A) Right eye. (B) Left eye. (A and B) ILM-RPE map on the macular cube 200×200. Cross points of vertical and horizontal lines show fixation points (white crosses). (C) B-scans. The bars show the fixation points (white arrows).
Abbreviations: ILM-RPE, internal limiting membrane – retinal pigment epithelium; SD-OCT, spectral domain optical coherence tomography.
