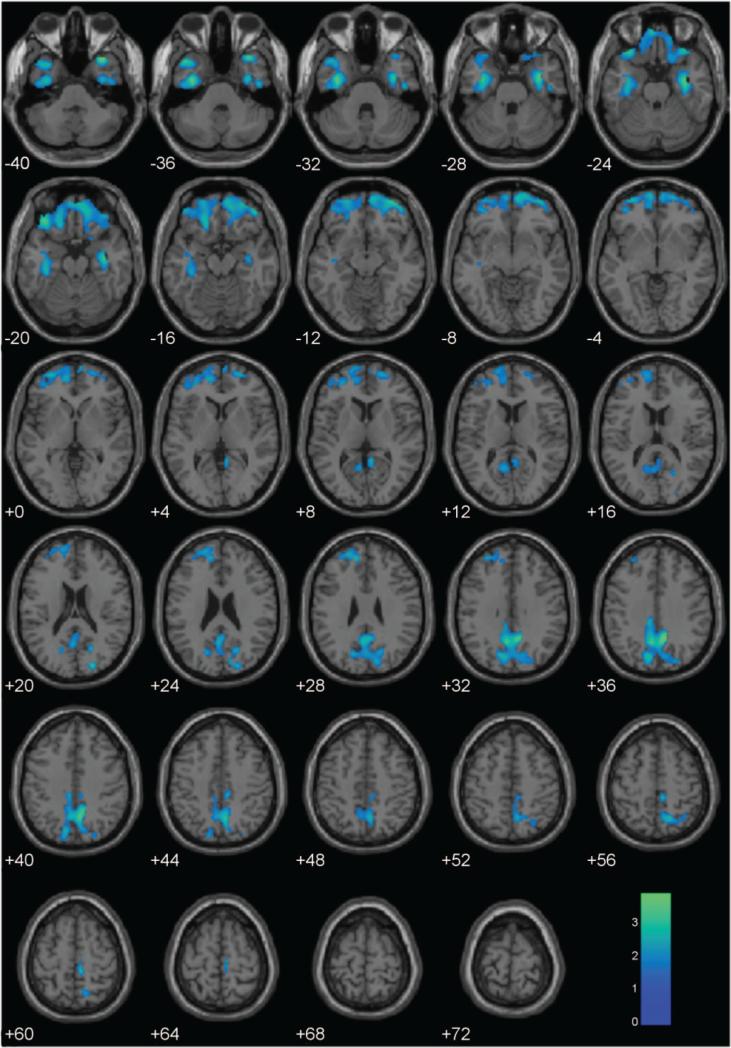
Figure 2.
Regional gray matter volumes negatively associated with PCL-R Total scores, controlling for BV, age, and substance dependence. These regions are significant in the whole brain at p < .05 and 1308-voxel extent (selected using AlphaSim). Numeric values indicate the MNI z-coordinate of the slice, and the color bar represents t-values.

