
Figure 2.
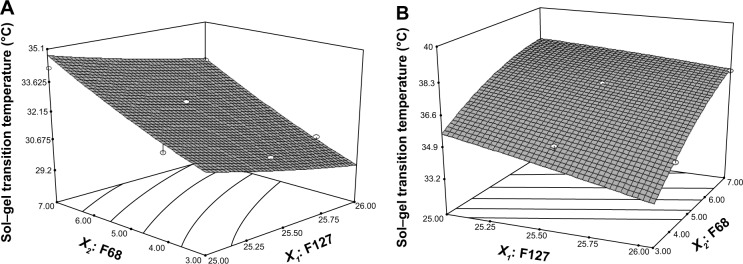
Response surface plot showing concentration effect of Pluronic® F127 (X1) and Pluronic® F68 (X2) on sol–gel transition temperature. Sol–gel transition temperatures of in situ gels before (A) and after (B) dilution both increased with the increased concentration of Pluronic F68 and decreased concentration of Pluronic F127.