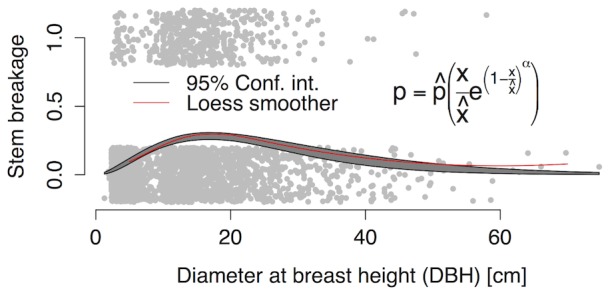
Figure 1. Tree stem breakage after the 2008 ice storm along tree size.

Broken stems are scattered around 1 and stems not broken around 0. The red line represents a moving window (Loess) smoother for breakage incidences. The dark grey polygon represents the 95% confidence interval for the probability of breakage of individual stems based on the posterior distribution estimated using a power Ricker function (Equation 1).  refers to the maximum breakage probability, x is the stem DBH,
  is the DBH at maximum breakage probability and α is a scaling parameter that increases the flatness of the curve at maximum breakage probability.
