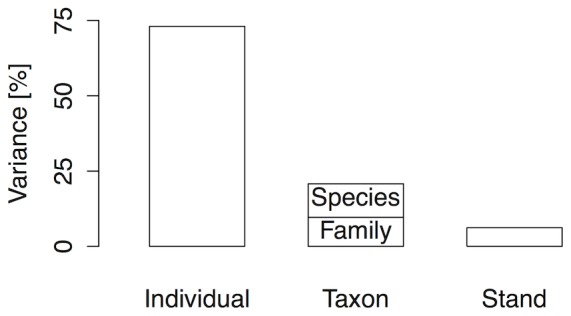
Figure 2. Partitioning the magnitude of variance into the taxon and the stand random variance components.

The taxon variance component consisting of species and family effects explained 11% and 10% of the total variance components for DBH corrected breakage probability; the stand variance component explained 6%. The remaining 73% are unexplained variation at the level of the individual tree.
