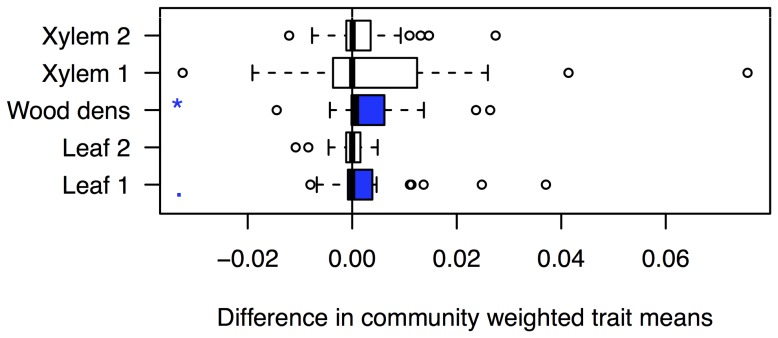
Figure 3. Differences in community weighted mean traits after the ice storm.
Blue indicates a significant or marginal increase after the ice storm. Wood density and the first leaf trait axis (increasing SLA) both increased. See Appendix S2 for a detailed description of the species trait axes.

