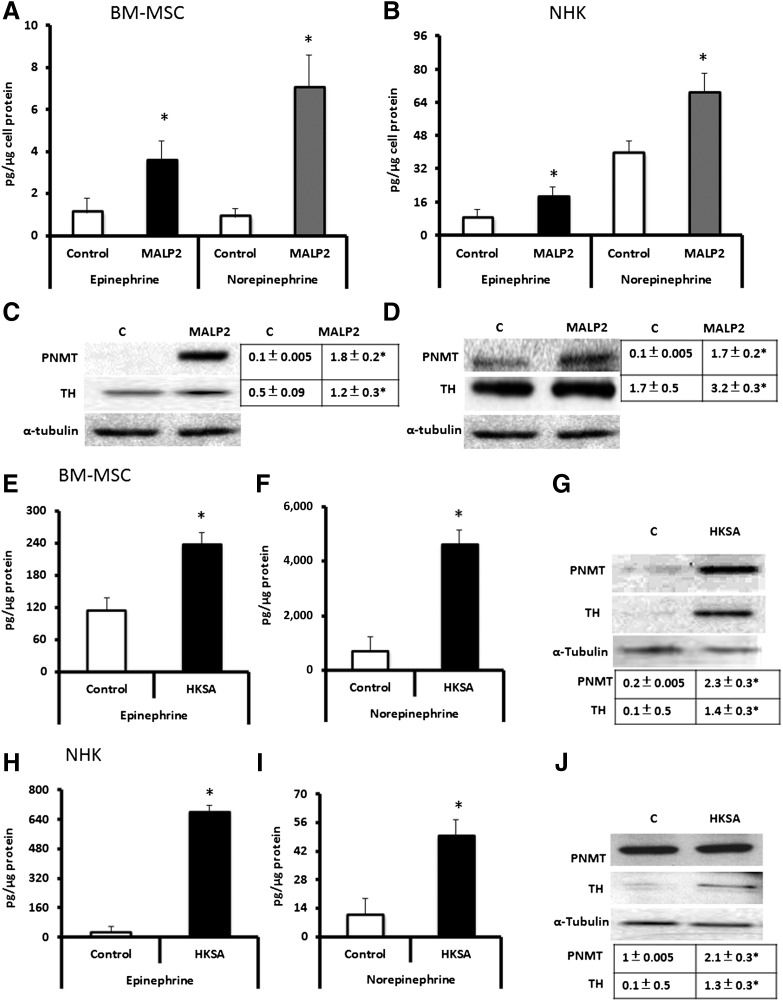
Figure 5.
MALP2 and HKSA induce catecholamine secretion and catecholamine-producing enzymes in BM-MSCs/NHKs. (A, B): BM-MSCs (A) and NHKs (B) were stimulated with 100 ng/ml MALP2 in vitro. Cell culture supernatants were collected and analyzed by high-performance liquid chromatography (HPLC) for EPI and norepinephrine, as described in Materials and Methods. All data are presented as pg/μg cell protein (mean ± SD). ∗, p < .05 versus control (n = 4 experiments). (C, D): BM-MSCs (C) and NHKs (D) were stimulated in vitro with 100 ng/ml MALP2. Total cell protein was isolated and subjected to Western blot analysis for PNMT or TH enzymes. α-Tubulin was used as a loading control. Densitometric ratios (PNMT/α-tubulin and TH/α-tubulin) are shown in the adjacent table. ∗, p < .05 versus control (C) (n = 4 experiments). (E, F): Epinephrine (E) and norepinephrine (F) levels in BM-MSCs stimulated with HKSA (104 cells per milliliter) in vitro. Cell culture supernatants were collected and analyzed by HPLC for EPI and norepinephrine, as described in Materials and Methods. All data are presented as pg/μg cell protein (mean ± SD). ∗, p < .05 versus control. (G): BM-MSCs were stimulated in vitro with 104 cells per milliliter HKSA in vitro. Total cell protein was isolated and subjected to Western blot analysis for PNMT or TH enzymes. α-Tubulin was used as a loading control. Densitometric ratios (PNMT/α-tubulin and TH/α-tubulin) are shown in the adjacent table. ∗, p < .05 versus control (C) (n = 4 experiments). (H, I) Epinephrine (H) and norepinephrine (I) levels in NHKs stimulated with HKSA (104 cells per milliliter) in vitro. Cell culture supernatants were collected and analyzed by HPLC for EPI and norepinephrine, as described in Materials and Methods. All data are presented as pg/μg cell protein (mean ± SD). ∗, p < .05 versus control (n = 3). (J): NHKs were stimulated in vitro with 104 cells per milliliter HKSA in vitro. Total cell protein was isolated and subjected to Western blot analysis for PNMT or TH enzymes. α-Tubulin was used as a loading control. Densitometric ratios (PNMT/α-tubulin and TH/α-tubulin) are shown in the adjacent table. ∗, p < .05 versus control (C) (n = 4 experiments). Abbreviations: BM-MSCs, bone marrow-derived mesenchymal stem cells; C, control; HKSA, heat-killed Staphylococcus aureus; MALP2, macrophage-activating lipopeptide-2; NHKs, neonatal keratinocytes; PNMT, phenylethanolamine N-methyltransferase; TH, tyrosine hydroxylase.

