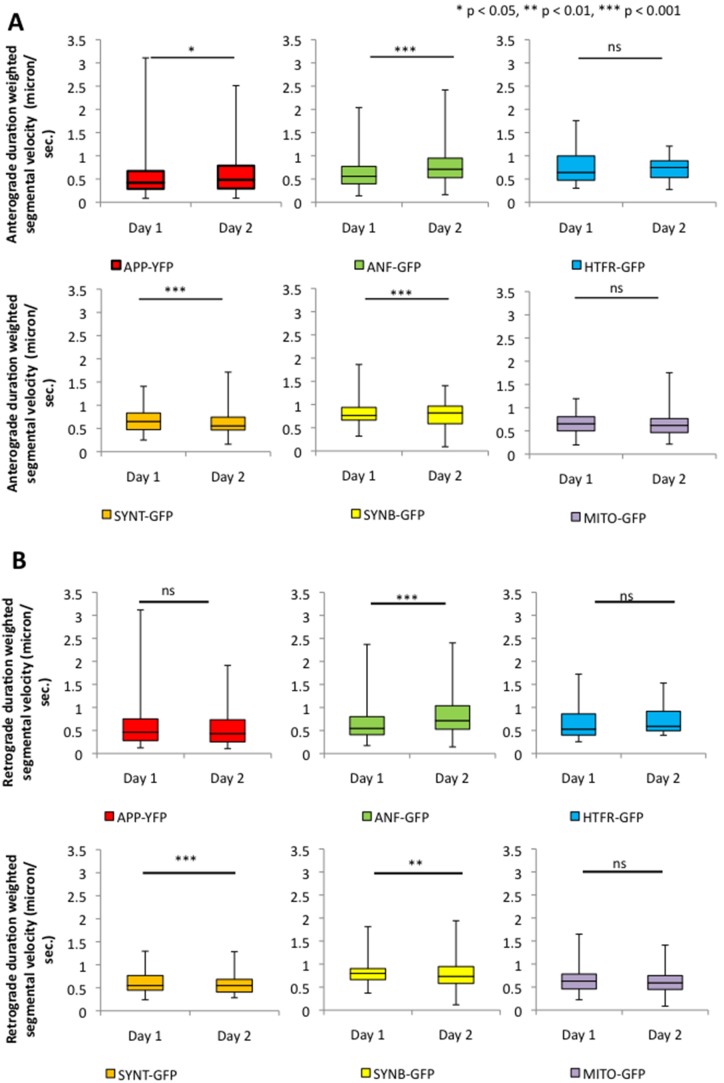
Figure 2. Anterograde and retrograde velocities of GFP/YFP tagged vesicles/cargo significantly change temporally.
The average duration weighted segmental velocities of six vesicles/organelle revealed significant shifts in their movement dynamics at day 2 compared to day 1. Box-plots outline the distribution of vesicle velocities. Upper and lower box edges represent 75th percentile and 25th percentile respectively. Upper and lower whiskers represent the maximum and minimum of vesicle velocities respectively. The horizontal line represents the median of vesicle velocities. (A) The anterograde duration-weighted segmental velocity of APP-YFP vesicles significantly increased at day 2 (p = 0.015). Anterograde segmental velocity distributions of ANF-GFP vesicles also significantly increased at day 2 (p = 1.068E-6). Strikingly, anterograde segmental velocity of SYNB-GFP vesicles and SYNT-GFP vesicles significantly decreased over time (p = 3.484E-6 and p = 0.0004, respectively). HTFR-GFP and MITO showed no significant change at day 2 compared to day 1. (B) The retrograde duration-weighted segmental velocity of ANF-GFP significantly increased (p = 1.092E-7), while SYNB-GFP significantly decreased over time (p = 6.043E-7). APP-YFP, HTFR-GFP, SYNT-GFP, and MITO-GFP showed no significant changes at day 2 compared to day 1. N = 10 cells; *p<0.05, **p<0.01, ***p<0.001 by Wilcoxon-Mann-Whitney rank sum test for nonparametric distributions. NS = not significant.

