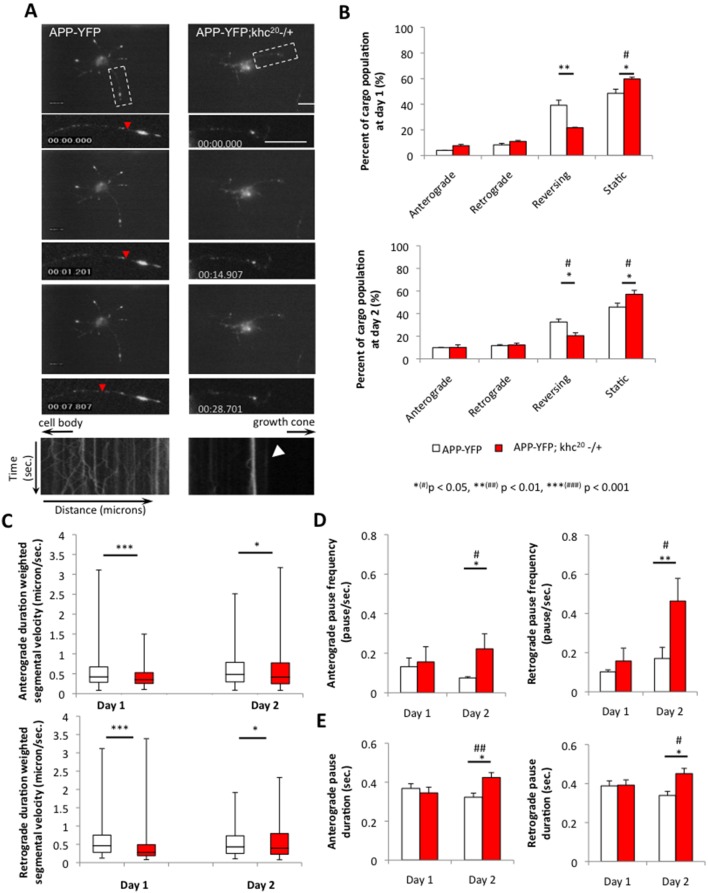
Figure 4. 50% reduction of kinesin-1 perturbs the movement of APP vesicles.
(A) A representative movie montage from a single neuron is shown from a primary neuronal culture expressing APP-YFP in the context of 100% kinesin-1 (APP-YFP) or 50% kinesin-1 (APP-YFP;khc20−/+). The axonal neurite is boxed and is enlarged with its kymograph. Note that 50% reduction of kinesin-1 (APP-YFP;khc20−/+) causes many stalled APP-YFP vesicles compared to neurites containing 100% kinesin-1 (arrowhead). Robust movement is seen in the kymograph with 100% kinesin-1 (APP-YFP, red arrowhead) in contrast to stalled vesicles seen in the kymograph with 50% reduction of kinesin-1. Y-axis depicts time in seconds and X-axis depicts distance traveled in microns. The cell body and growth cone directions are depicted by the arrows. Bar = 10 microns. (B) Quantitative analysis of the percent of cargo population indicates that 50% reduction of kinesin-1 significantly increases the percentage of stationary vesicles (pday1 = 0.002 and pday2 = 0.031) and decreases the percentage of reversing vesicles compared to 100% kinesin-1 at both day 1 and day 2 (pday1 = 0.013pday2 = 0.021) both at day 1 and day 2. (C) Both the anterograde (pday1 = 0.0002 and pday2 = 0.045) and retrograde (pday1 = 5.523E-5 and pday2 = 0.044) median duration weighted segmental APP velocities significantly decreased with 50% reduction of kinesin-1 compared to 100% kinesin-1 at day 1 and day 2. Upper and lower box edges represent 75th percentile and 25th percentile, respectively. Upper and lower whiskers represent the maximum and minimum of the data, respectively. The horizontal line represents the median. Significance was determined by Wilcoxon-Mann-Whitney rank sum test for nonparametric distributions. At day 2, both the anterograde and retrograde (D) pause frequencies (pantero = 0.034 and pretro = 0.002) and (E) pause durations (pantero = 0.028 and pretro = 0.039) significantly increased in axonal neurites containing 50% reduction of kinesin-1 compared to axonal neurites containing 100% kinesin-1. N = 10 cells; *(#) p<0.05, **(##) p<0.01, ***(###) p<0.001 by two-tailed Student t-test (*) and by Bonferroni’s test (#).Bar = 10 microns.

