
Figure 3. Fos immunoreactivity in the habenula following a neonatal immune challenge and subsequent inflammatory pain.
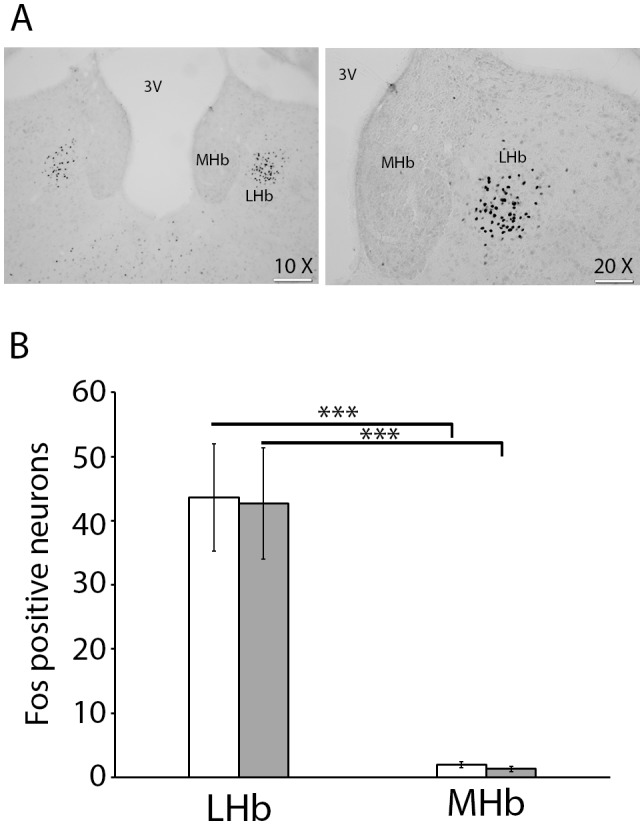
(A) Representative examples illustrate the distribution of Fos-positive nuclei in the lateral and medial habenula (LHb & MHb, respectively). (B) Quantification of Fos-positive nuclei in LHb and MHb in neonatal saline (white bar) and LPS-treated rats (grey bar) after formalin injection in preadolescent rats. 3V: third ventricle. ***p<.001. Scale bar = 100 µm for the 10x microscopic objective and 200 µm for 20x microscopic objective.