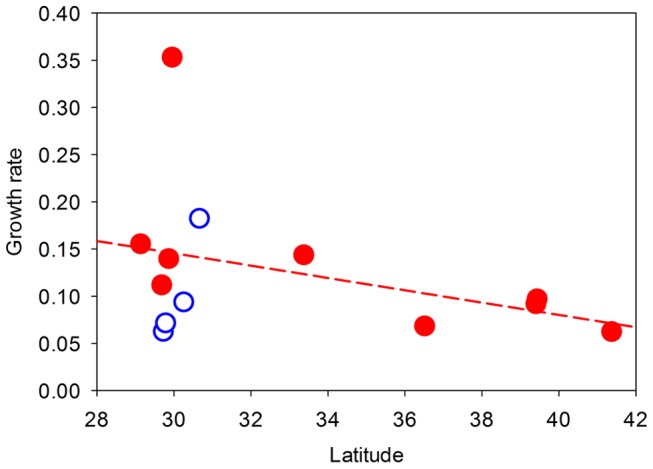
Figure 4. Effect of latitude on P. australis growth.

Annual growth rate (proportional change in ln area) of P. australis patches as a function of latitude in the coastal marshes of the United States. Filled and open symbols represent sites occupied by Eurasian and Gulf-Coast haplotypes respectively. Line is fit by least-squares regression (both haplotypes combined; R 2 = 0.14, P = 0.20).
