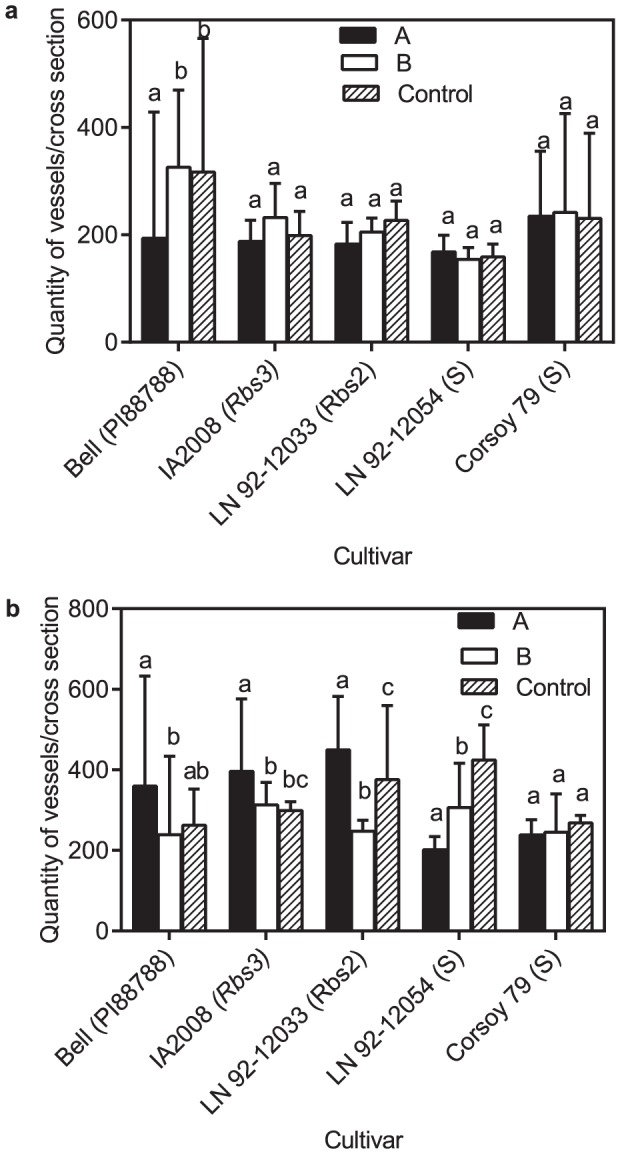
Figure 4. Average quantity of vessels of stems during latent and pathogenic infection with Phialophora gregata.

Average quantity of vessels per cross section of stems two (A) and six (B) weeks post inoculation with either type A (PgA) or B (PgB) of Phialophora gregata for six soybean cultivars. Letters in parentheses next to cultivars indicate the source of BSR resistance or if the cultivar is susceptible (S). Treatments were compared using an ANOVA followed by a Fisher's LSD test, and bars with different letters are significantly different (P = 0.05). Error bars indicte 95% confidence intervals of the mean. Data shown is from experiment 1 and 3.
