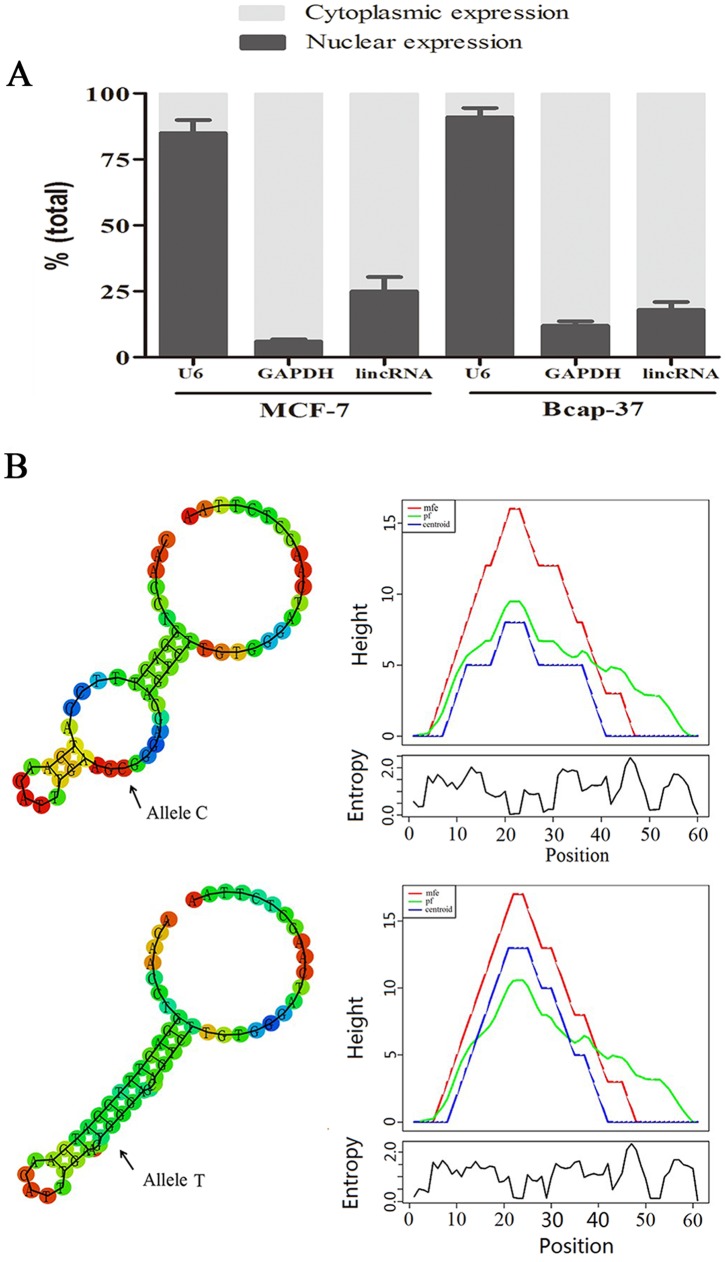
Figure 1. Cellular and molecular characterization of lincRNA-ENST00000515084.
(A) The levels of nuclear control transcript (U6), cytoplasmic control transcript (GAPDH mRNA), and lincRNA-ENST00000515084 were assessed by RT-qPCR in nuclear and cytoplasmic fractions. Data are mean±standard error of the mean. Data are presented as a percentage of U6, GAPDH and lincRNA-ENST00000515084 levels and total levels for each were taken to be 100%. (B) In-silico prediction of folding structures induced by rs12325489C>T in lincRNA-ENST00000515084. The mountain plot is an xy-graph that represents a secondary structure including MFE structure, the thermodynamic ensemble of RNA structures (pf), and the centroid structure in a plot of height versus position. “mfe” represents minimum free energy structure; “pf” indicates partition function; “centroid” represents the centroid structure.

