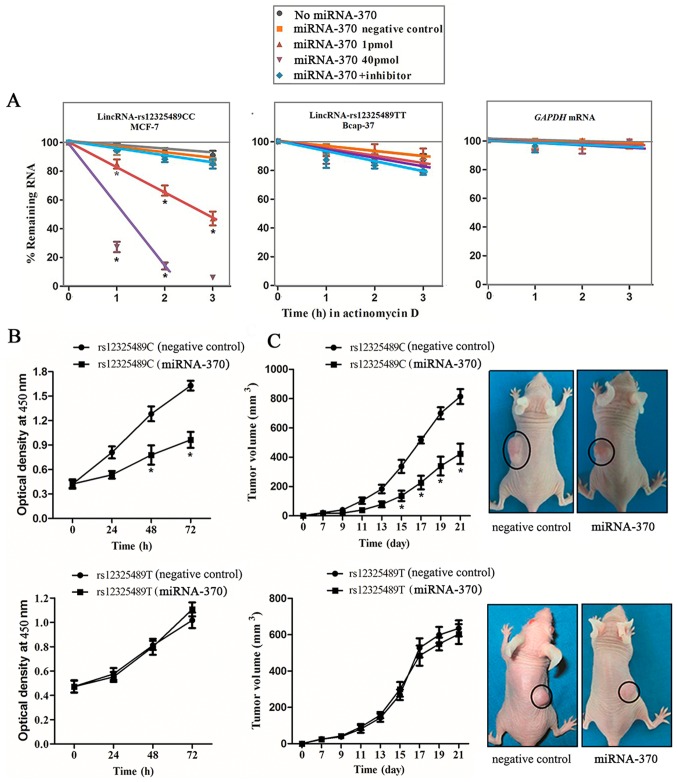
Figure 3. Effects of rs12325489C>T genotypes on cells’ proliferation and tumor growth.
(A) The different steady-state of lincRNA-ENST00000515084 in rs12325489TT (Bcap-37) cells and rs12325489CC (MCF-7) cells. Twenty-four hours after transfecting with miRNA-370 mimics or miRNA-370 inhibitor, rs12325489TT (Bcap-37) cells and rs12325489CC (MCF-7) cells were incubated with actinomycin D for 1, 2 or 3 hours. The decline transcript levels of lincRNA-ENST00000515084 and GAPDH mRNA levels after actinomycin D treatment was measured by real-time PCR analysis; data are mean±standard error of the mean, normalized to GAPDH. *P<0.05 compared with control. (B) Cells’ proliferation rate was significantly inhibited in rs12325489CC (MCF-7) cells by binding miRNA-370. Cell proliferation was performed by the cell viability assay. Six replicates for each group and the experiment repeated at least three times. Data are mean±standard error of the mean (P = 0.001). *P<0.05 compared with control. (C) Effects of rs12325489C>T genotypes on tumor growth by binding miRNA-370. Figure shown is a representative of five nude mice for each group at the third week after xenograft-transplanted nude mouse tumor models of human breast cancer growth established. *P<0.05 compared with control.

