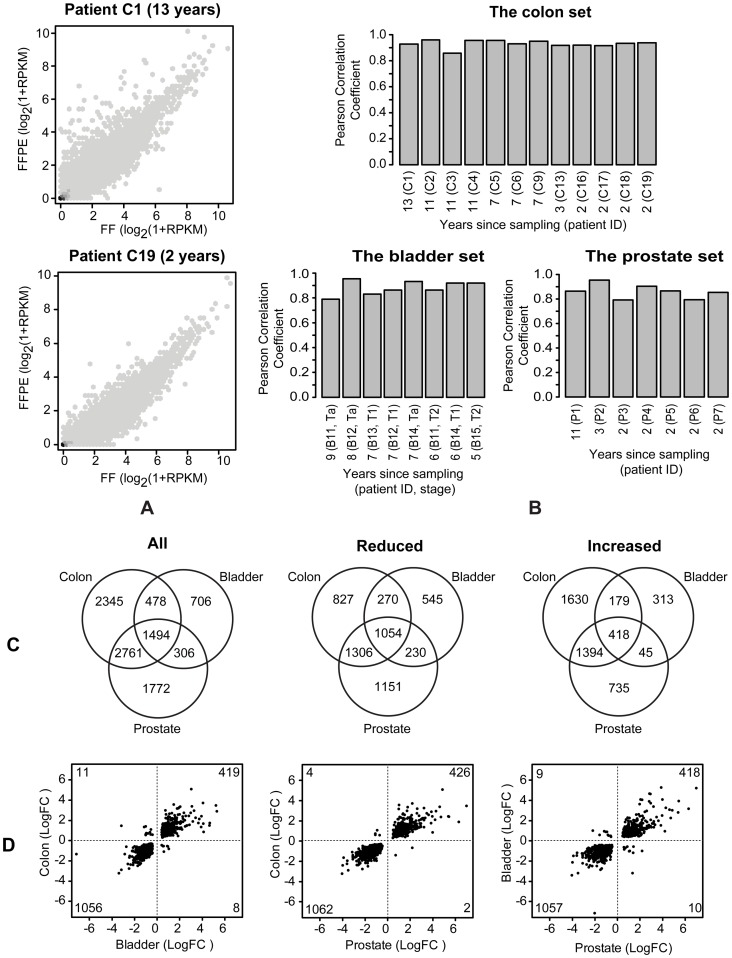
Figure 5. Effect of the FFPE process on the expression profiles.
(A) Correlation plots of log2(1+RPKM) values for FF and FFPE colon samples stored for 13 years (top) and 2 years (bottom). (B) Pearson correlation coefficients of log2(1+RPKM) values for FF vs. FFPE from the three paired FF/FFPE sample sets. (C) Intersection analyses of the results from paired statistical tests for significantly (FDR<0.05) affected genes comparing FF and FFPE samples within each sample set (divided into all affected, reduced and increased genes). (D) Plots of log-fold change values of the 1,494 genes affected in common, among all affected genes, for each pairwise combination of the three tissue sets with numbers of genes indicated for each quadrant.

