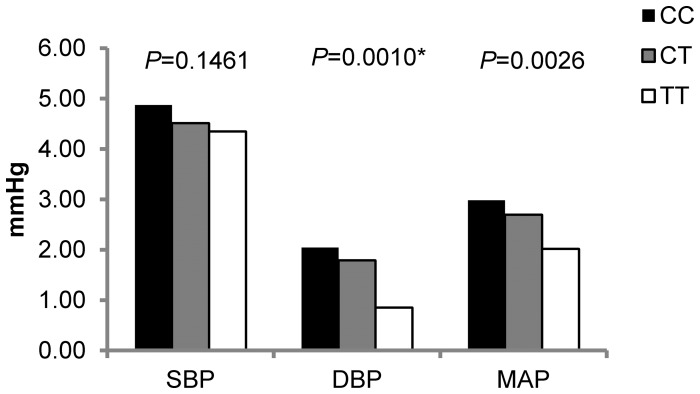
Figure 1. –log10 P values for the associations of 39 SNPs in SGK1, SGK2 and SGK3 with blood pressure responses to low-sodium intervention (a) and high-sodium intervention (b).
Labeled SNP was significant after Bonferroni correction. The horizontal dashed lines indicate the Bonferroni corrected significant level.

