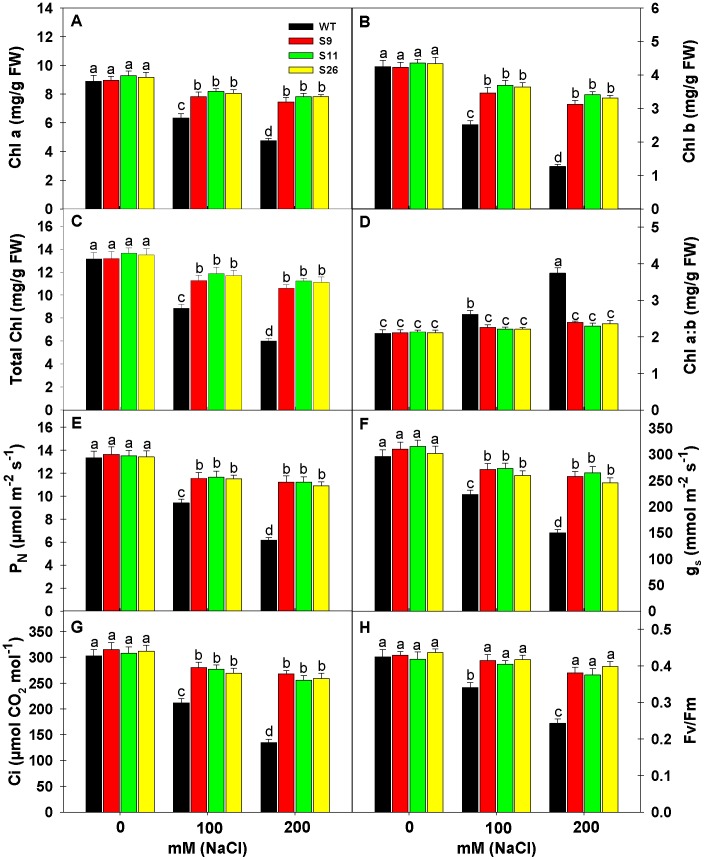
Figure 5. Effects of salinity stress on chlorophyll content, photosynthesis and chlorophyll fluorescence of transgenic and WT tobacco plants.
(A) Chlorophyll a content. (B) Chlorophyll b content. (C) Total Chlorophyll content. (D) Ratio of Chlorophyll a and b. (E) Measurement of Net photosynthetic rate (PN). (F) Measurement of stomatal conductance (gs). (G) Measurement of internal CO2 concentration [(Ci)]. (H) Measurement of Chlorophyll fluorescence (Fv/Fm). Data’s were recorded from WT and p68 overexpressing transgenic tobacco lines after 3 weeks exposure to 0, 100 or 200 mM NaCl treatment. Each value represents mean of three replicates ± SE. Means were compared using ANOVA. Data followed by the same letters are not significantly different at P<0.05 as determined by least significant difference (LSD) test. a, b, c indicate significant differences at P<0.05 level as determined by Duncan’s multiple range test (DMRT).

