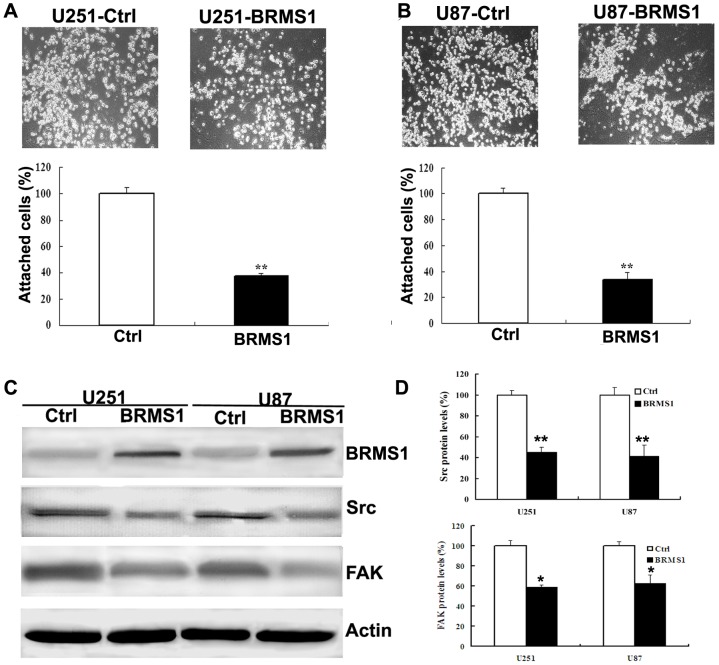
Figure 4. Overexpression of BRMS1 inhibits glioma cells adhesion ability.
A, B Cell attachment assay after BRMS1 overexpression in U251 and U87 cells. The graph shows the percentage of attached cells compared with the control group. C Western blot analysis of the relative protein levels of Src and FAK in BRMS1 overexpression and control group for both U251 and U87 cell lines. D Quantitative analysis of relative protein level of Src and FAK in glioma U251 and U87 cells. All experiments were carried out in triplicate. Data are shown as mean ± SD. *P<0.05, **P<0.01.

