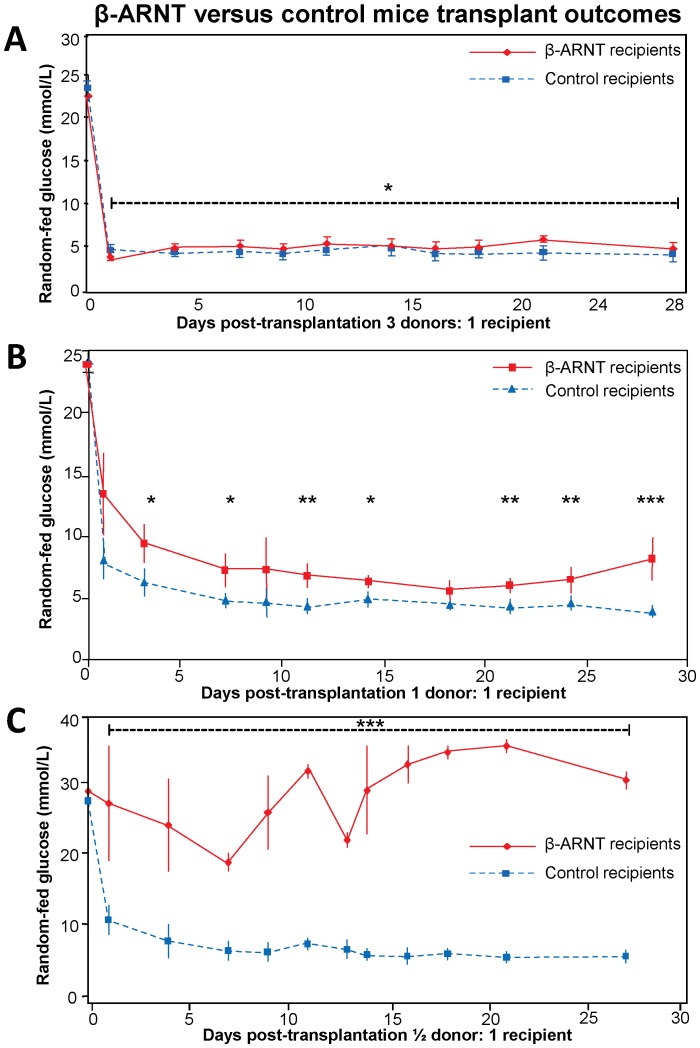
Figure 3. β-ARNT versus control mice transplant outcomes.
(A) The 3∶1 transplant model shows that both β-ARNT and control recipients achieve reasonable glucose control suggesting that when a large mass of these islets are transplanted, even β-ARNT islets can function well (n = 4 per group) (* = p<0.05). (B) The 1∶1 transplant model shows that β-ARNT recipients have higher glucoses compared to control recipients (n = 6 per group) (*** = p<0.001, ** = p<0.01, * = p<0.05). (C) The ½:1 transplant model shows that β-ARNT recipients have severe glucose intolerance compared to control recipients (n = 4 per group) (*** = p<0.001). Data are presented as means ± SEMs.

