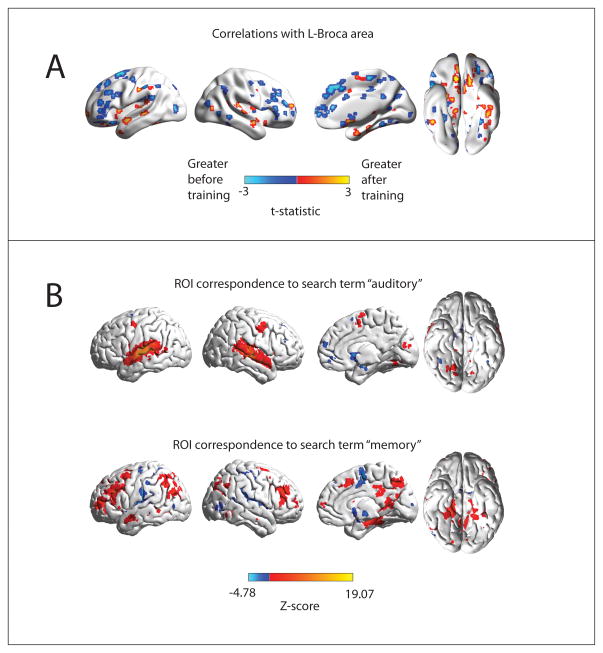
Figure 3.
Spatial distribution of changes in functional connectivity to left Broca Area. A: Changes in functional connectivity after vs. before cognitive training of 7266 ROIs covering the gray matter to left Broca Area. Colored ROIs show regions that exhibited differential functional connectivity, thresholded at p<0.05, uncorrected, for display. B: Voxels showing significant reverse inference to the terms “auditory” and “memory” in the neuroimaging literature from the NeuroSynth database. Color scale represents Z-score for loading of the respective terms at each voxel, corrected for multiple comparisons with False Discovery Rate q<0.05.

