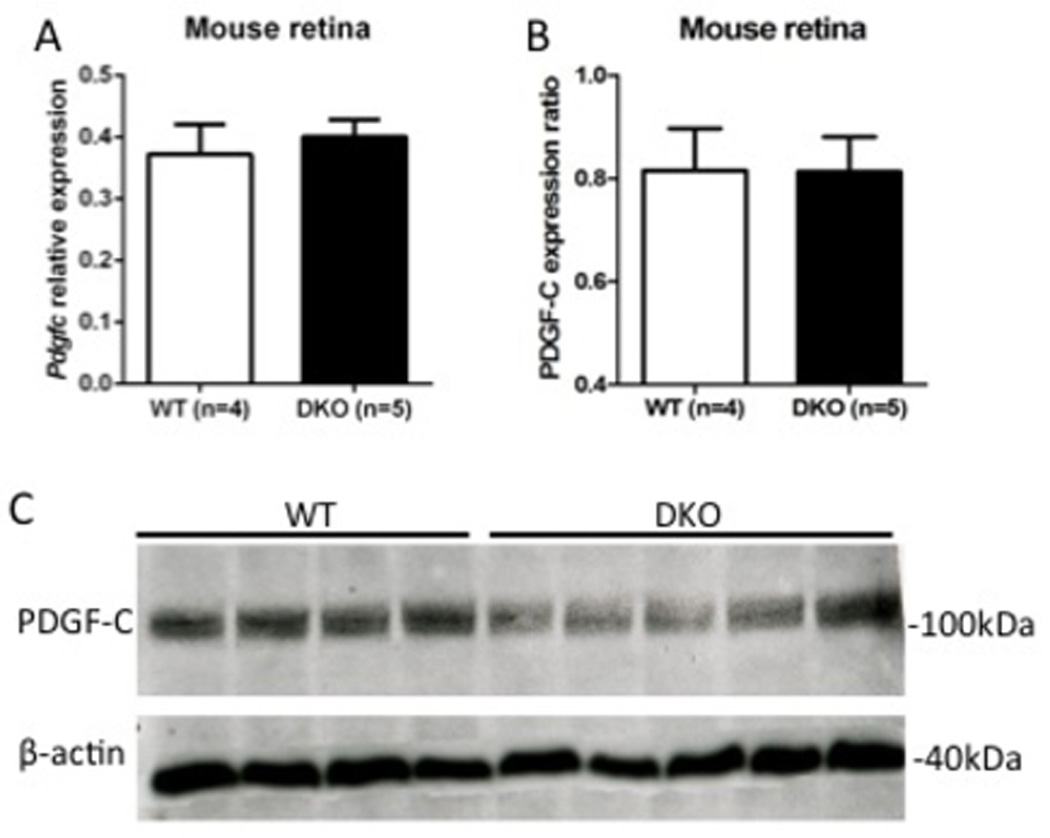
Figure 1. PDGF-C level in the retina of DKO rd8 and WT.

A) Pdgfc transcript levels in freshly isolated retina from WT (n=4) than DKO rd8 (n=5) mice using quantitative reverse transcription-polymerase chain reaction. Pdgfc transcript is comparably expressed between WT and DKO rd8 mice. B) The PDGF-C protein ratio of Western blot is calculated relative to β-actin (loading control). Image-J software is used to measure the band intensity in pixels. C) Western blot detected PDGF-C expression in the retina in both WT and DKO rd8 mice. The size of molecular weight is given in kDa.
