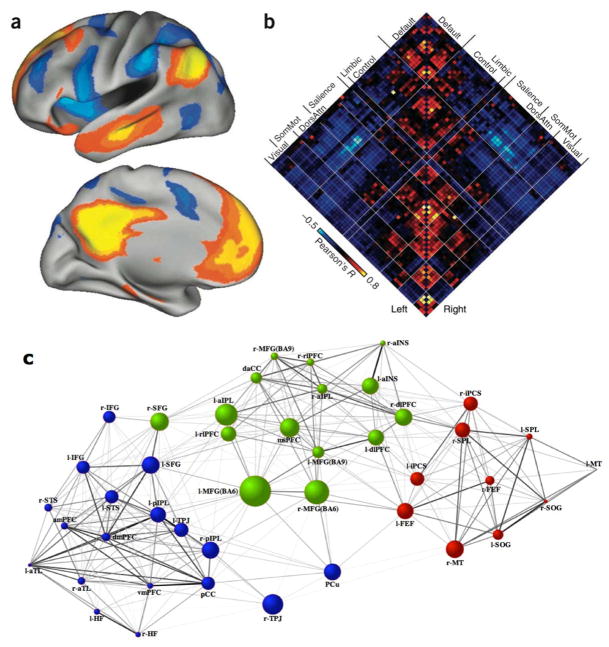
Figure 5.
The default network and large-scale network interactions examined using resting-state functional connectivity MRI. (A) RSFC of the DN and anticorrelation with the DAN. Adapted from Ref. 185.(B) A correlation matrix shows the coupling architecture of the cerebral cortex measured at rest. Between-network correlations are characterized by both positive and negative relations, with strong anticorrelation notable between the default and salience/dorsal attention networks. Adapted from Ref. 185. (C) Interregional pairwise connectivity graph within and between the default (blue), dorsal attention (red), and frontoparietal control (green) networks. Line weights represent the magnitude of the positive correlation between nodes. Node size represents the magnitude of betweenness centrality, a graph analytic measure of its contribution as an inter-network connector hub. Adapted from Ref. 163.

