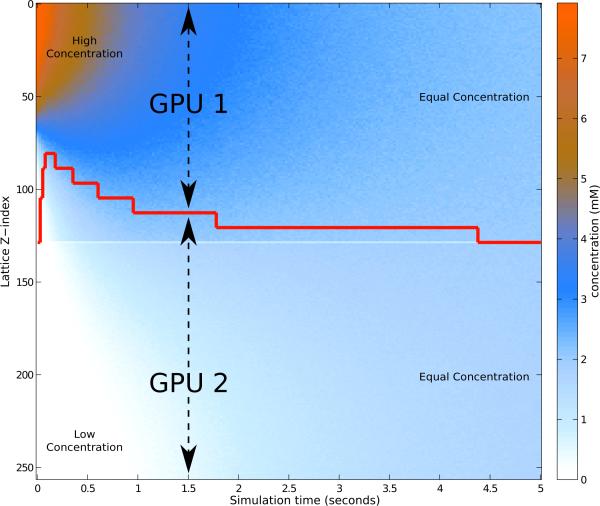
Figure 8.
Load balancing distribution over time for a diffusion simulation on two GPUs. The time-varying spatially heterogeneous concentration of particles is represented in the graph with the vertical axis corresponding to lattice z-dimension, and color corresponding to particle concentration in that lattice plane. At t = 0, all of the particles are in the upper quarter of the volume, and a barrier in the center slows the flow of particles into the lower half of the volume. The red line indicates the spatial division of the lattice between the two GPUs over time as the load balancer reassigns work in response to changing particle densities.

