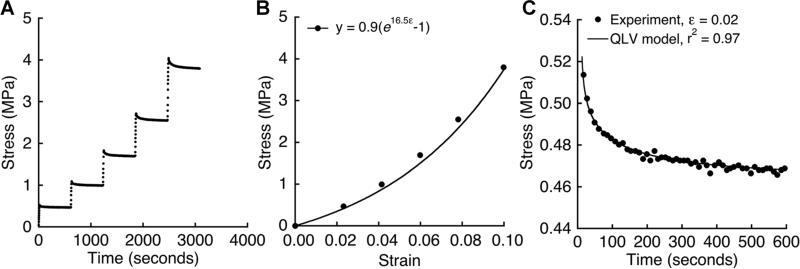
Figure 3.
(A) Example of stress-time behavior in response to 2% strain increments applied after 10-min relaxation periods. (B) Equilibrium stress versus applied strain for the incremental loading in panel A. (C) Stress relaxation behavior after the first strain increment in panel A. Stress-time data were fit to a five-parameter QLV model using nonlinear optimization (see the Methods Section for model details).

