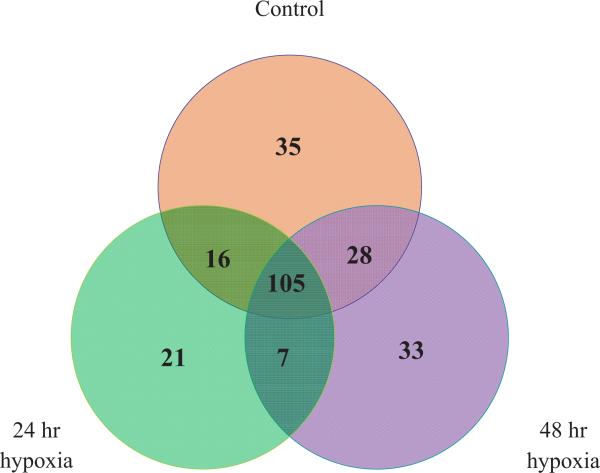
Fig. (2).
Venn diagram showing the numbers of miRNAs that were expressed in rat pericytes constitutively (orange circle) or following 24 hr (green circle) and 48 hr (purple circle) hypoxia. A total of 105 miRNAs were present in all 3 groups while only 7 were present in the hypoxic groups but not in the control group 35 miRNAs were present in the control group but not detectable in the hypoxic groups.

