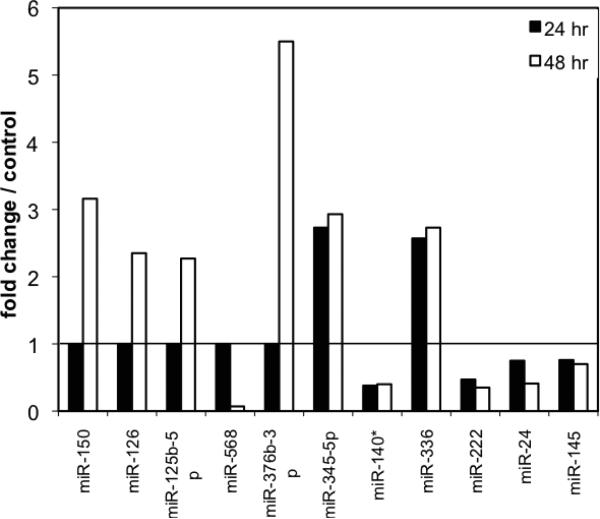
Fig. (4).
Based on the array results, the miRNAs most affected after hypoxia were graphed. Relative fold change in expression was given in comparison to control normoxic pericytes, which was set at 1. Black bars represent the 24h hypoxia group and the white bars represent the 48h hypoxia group. Most miRNAs were down-regulated after 24h hypoxia. The greatest up-regulation occurred after 48 h hypoxia.

