
Figure 4.
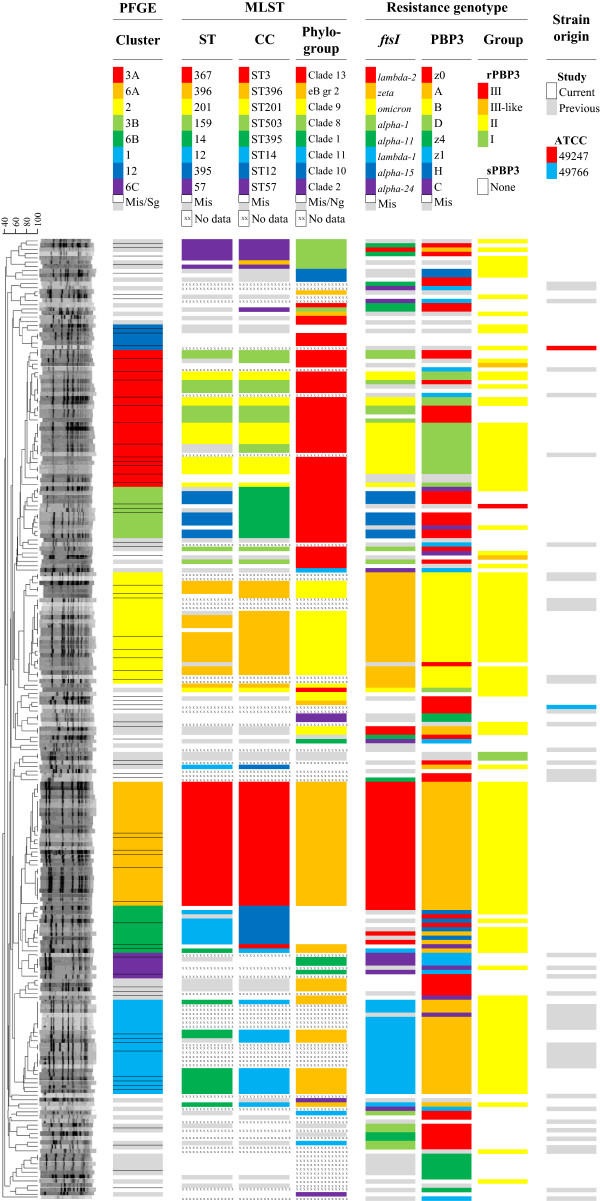
PFGE dendrogram. The correlation between phylogenetic groups (PFGE and MLST) and resistance genotypes. UPGMA dendrogram of band patterns for the 177 isolates in the Resistant group and 46 isolates from a previous study [11]. Clusters of related or possibly related isolates by analysis of band patterns and Dice coefficient of similarity are indicated by colours. Horizontal lines separate different band patterns. Additional information about STs, CCs, phylogroups, ftsI alleles, PBP3 types, PBP3 groups and strain origin is provided. The colour scale (similar to Figure 3) indicates relative frequencies of various alternatives within each of the columns 1–6. eB gr2, eBURST group 2; Mis, miscellaneous; Sg, singletons; Ng, no phylogroup.