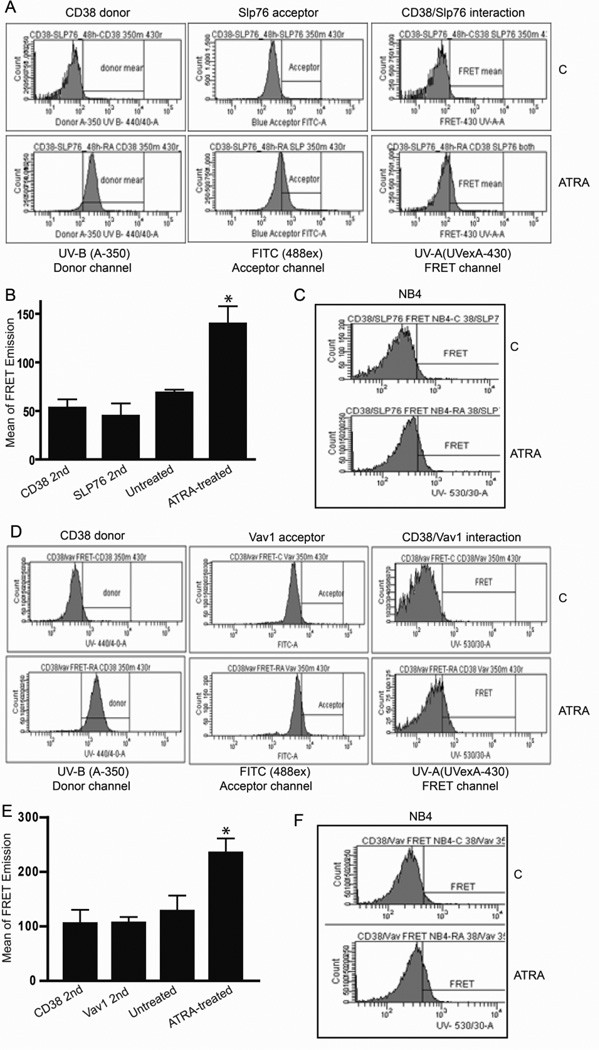
Figure 2. FRET corroborates the CD38/Vav1/SLP-76 interaction.
A: Flow cytometry FRET histograms confirm 48 hours of ATRA upregulates CD38 and SLP-76 expression and their interaction in HL-60 cells. B: Graph showing means of CD38/SLP-76 FRET emission in HL-60 cells. C: CD38/SLP-76 FRET interaction in NB4 cells after 48 hours of ATRA treatment. D: Flow cytometry FRET histograms confirm ATRA-upregulated CD38 and Vav1 expression and interaction in HL-60 cells. E: Graph showing means of CD38/Vav1 FRET emission in HL-60 cells. F: CD38/Vav1 FRET interaction in NB4 cells after 48 hours of ATRA treatment.

