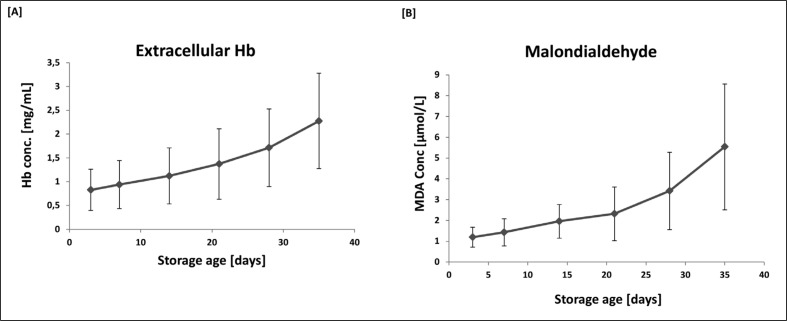
Figure 2.
Levels of extracellular Hb [A] and MDA [B] as a function of storage age.
Data are presented as the mean ± SD of ten sets of paediatric packs. ANOVA with post-ANOVA Duncan’s multiple comparison test confirmed significant differences (p<0.05) between all points analysed in plot A (Hb) with the exception of days 28 and 35, and days 28 and 21. Similarly, in plot B (MDA) significant differences were observed between all points with the exception of days 28 and 14.

