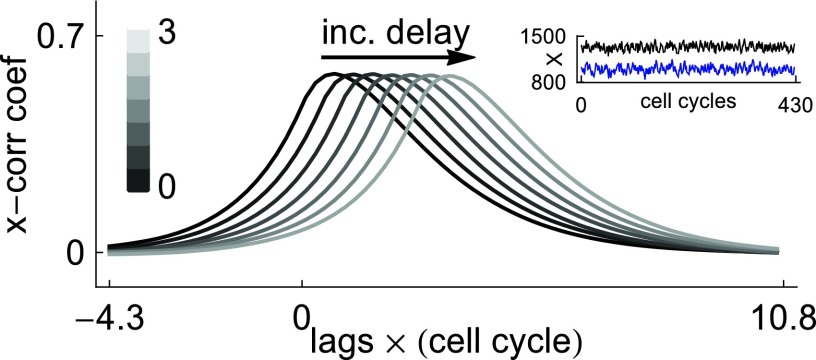
Figure 4.
Cross correlation functions for the two-species feed-forward architecture at system size N = 1000. The inset shows sample trajectories for X (black; top) and Y (blue; bottom). The mean field model has a fixed point, and for this reason, stochastic dynamics stay within a neighborhood of this fixed point (see Theorem 1). However, the effect of increasing delay is clearly seen in the cross correlation function. The color bar displays the delay size corresponding to the cross correlation curves. Parameter values are given by , , , b1 = b2 = ln (2), m = 1.33, μ = δτ. The cross correlations have been normalized by dividing by the standard deviations σX and σY of X and Y. Time has been normalized to cell cycle length.

