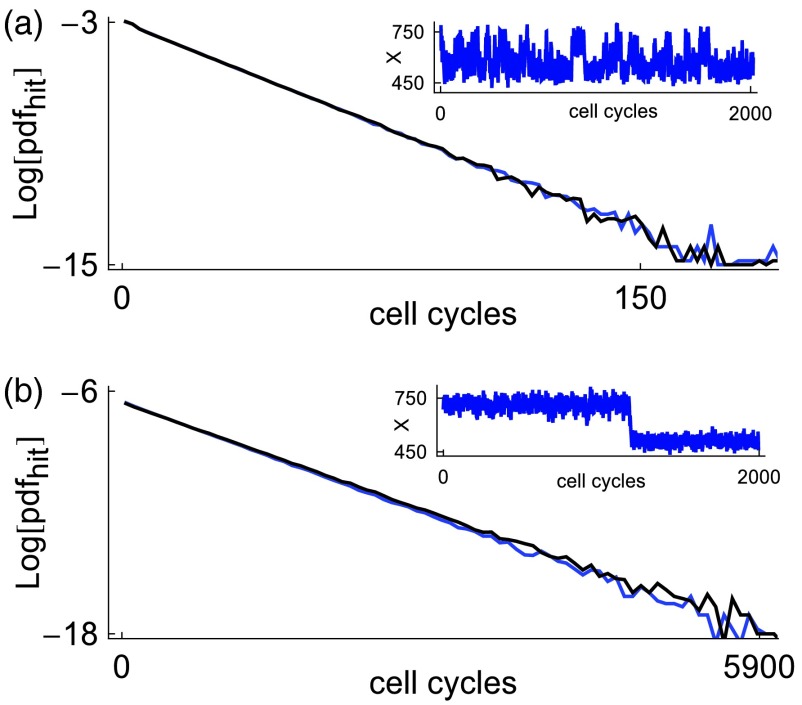
Figure 6.
Hitting time distributions for the positive feedback circuit. Black curves represent dSSA data; blue curves represent data from the dCLE approximation. (a) corresponds to the Markov case τ = 0 and a Hill coefficient of b = 15. (b) corresponds to a delay τ = 0.75 and b = 25. The tail of the hitting times distribution becomes longer with both increasing delay and increasing Hill coefficient b. The dCLE captures the lengthening of the tail due to both effects. Parameter values are α = 0.35, β = 0.15, c = 0.615, γ = ln (2), μ = δτ, N = 1000.

