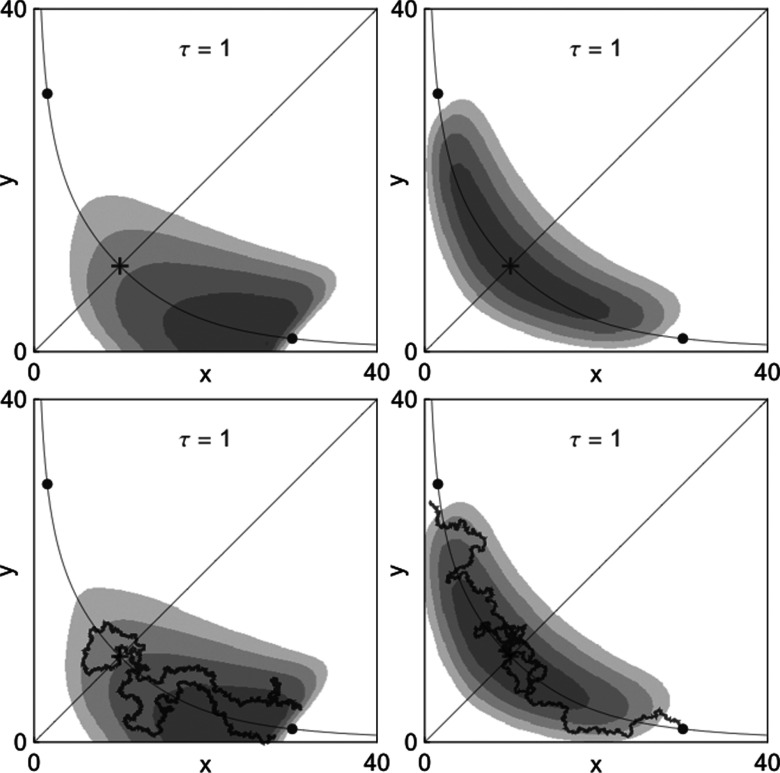
Figure 7.
Conditional density plots for the co-repressive toggle switch. The two left panels illustrate trajectories that leave a neighborhood of the stable point (xh, yl) and fall back into the same neighborhood before transitioning into a neighborhood of the stable point (xl, yh); displayed densities are conditioned on this set of trajectories. The two right panels illustrate trajectories that leave a neighborhood of (xh, yl) and transition to a neighborhood of (xl, yh) before falling back into the first neighborhood; displayed densities are conditioned on the set of such trajectories. Top panels correspond to dSSA; bottom panels correspond to dCLE. Cartoons of typical trajectories corresponding to failed transitions (left) and successful transitions (right) are shown for the dCLE process. Plots are shown for N = 30. The values of the other parameters are β = 0.73, k = 0.05, γ = ln (2).

