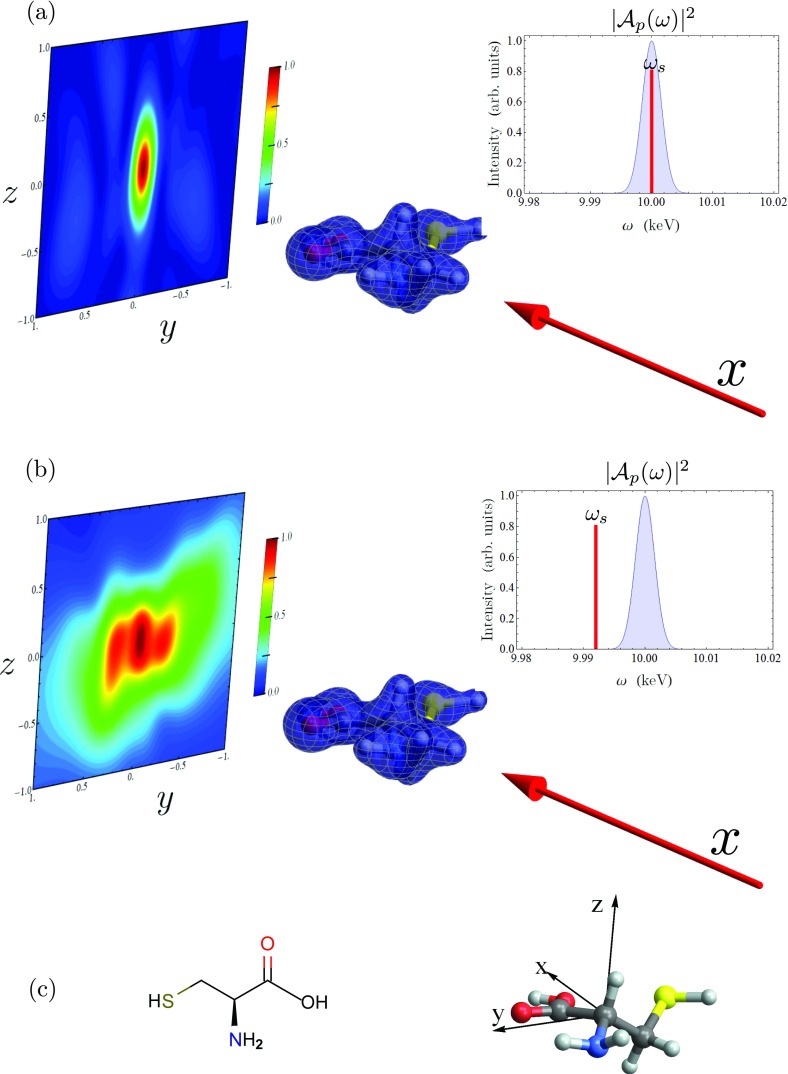
Figure 2.
Off-resonant scattering of a Gaussian X-ray pulse from cysteine for different detection frequencies. On the right, we show the pulse power spectrum in blue, with the detection frequency marked as a red line. The pulse propagation vector is shown as a red arrow, pointing at the molecule aligned in the lab frame, with the scattering pattern shown in the background. (a) The detection frequency ωs is set equal to the pulse center frequency Ωp, and the scattering signal is dominated by the elastic term. (b) The detection frequency is set to Ωp − 9 eV, and the inelastic terms are dominant. (c) Chemical structure (left) and lab-frame orientation (right) of the cysteine molecule (O is red, S is green, N is blue, C is grey, H is white).

