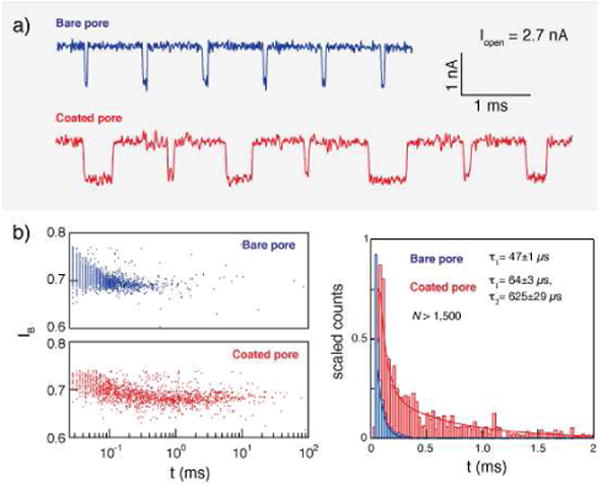
Figure 3.

Comparing translocation times through a bare nanopore (NP) and an NP-NFM. a) Representative current traces for 1000 bp dsDNA passing through the same NP, as a bare NP (upper) and as a 7:3 PCL:PGC-C18 NP-NFM (lower), showing similar blockage levels but some significantly slower translocation times for the NP-NFM (V=300 mV, Iopen = 2.7 nA). b) Histogram of event duration for the same uncoated NP (blue) and 7:3 PCL:PGC-C18 NP-NFM (red), showing exponential tail fits (error bar: τ ± 95% confidence interval).
