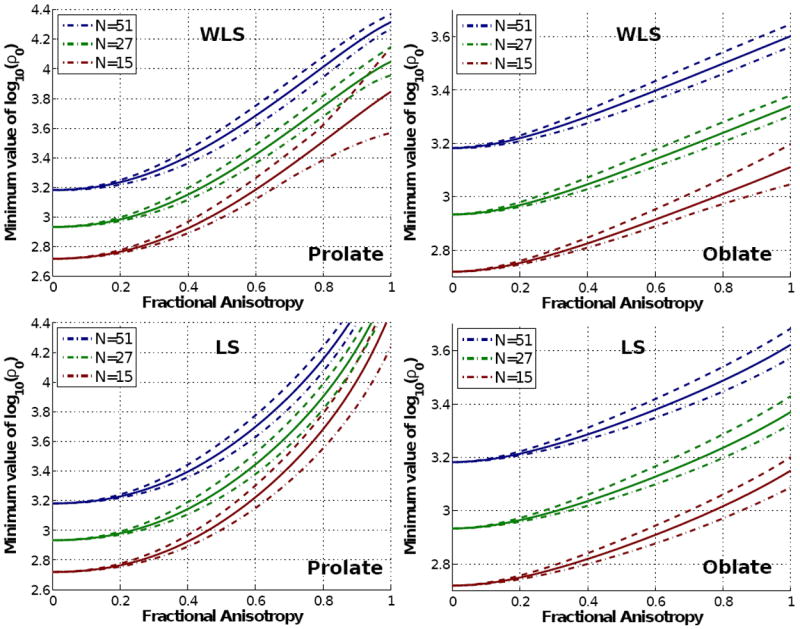
Fig. 3.

Log-plot of the minimum value of (related to the SNR in the baseline) which keeps the squared bias below the variance in the components of the DT for different tensor shapes. We show minimum, mean, and maximum values among all possible spatial orientations of the distinctive eigenvector of the tensor. The upper row shows the results for WLS reconstruction, and the bottom row those for LS.
