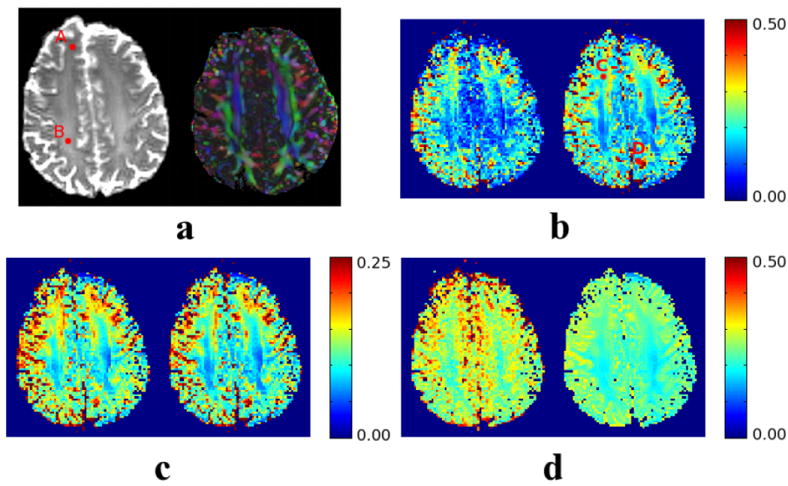
Fig. 7.

An axial slice of the brain of a healthy volunteer, acquired in a 3T, 8-coil Philips scanner. We show the baseline image and orientation color (a), and: the fraction of the MSE corresponding to the squared bias (b, relative units), the squared bias (c, absolute units), and the variance (d, absolute units). In all the cases, we show on the left hand side the sample values computed from 20 independent acquisitions and on the right hand side the values computed with our analytical expressions. The regions of interest are those corresponding to the white matter (vivid colors in a, right).
