
Figure 1.
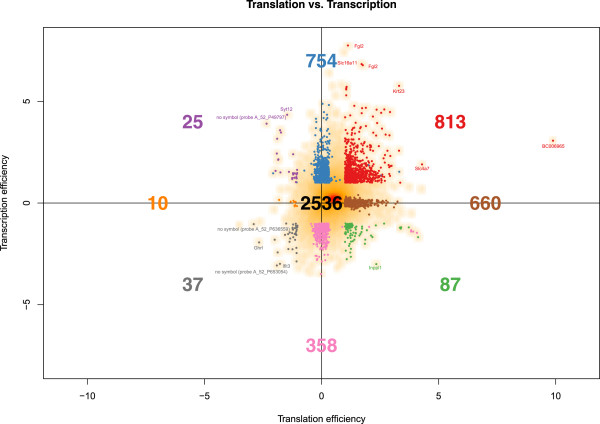
Changes in transcriptional and translational activity. The smooth scatter plot shows the genes of groups 1–9 in Table 1 with some selected outliers being highlighted.
Official websites use .gov
A
.gov website belongs to an official
government organization in the United States.
Secure .gov websites use HTTPS
A lock (
) or https:// means you've safely
connected to the .gov website. Share sensitive
information only on official, secure websites.
Changes in transcriptional and translational activity. The smooth scatter plot shows the genes of groups 1–9 in Table 1 with some selected outliers being highlighted.