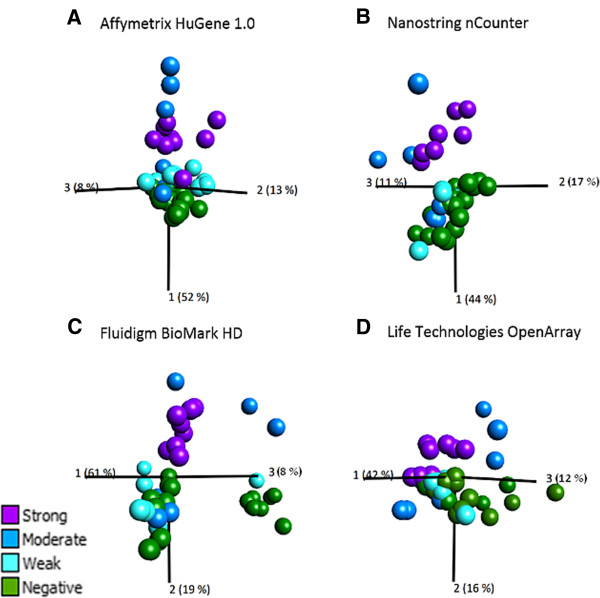
Figure 5.

Principal component analysis (PCA) of gene expression data after 24 h of chemical stimulation. To investigate overall similarities of gene expression data and to outline relevance of data from evaluated platforms for the GARD assay, gene expression data from 28 transcripts shared between all platforms were used for construction of PCA plots in the software Qlucore. Samples were colored according to sensitizing potency as defined by the LLNA assay. Subplots (A-D) illustrates PCA plots constructed from gene expression data obtained on the various platforms. A) Affymetrix®, 48 stimulations (weak (n = 9), moderate (n = 6), strong (n = 9), non-sensitizer (n = 24)). B) nCounter®, 42 stimulations (weak (n = 7), moderate (n = 6), strong (n = 7), non-sensitizer (n = 22)). C) BioMark HD, 39 stimulations (weak (n = 6), moderate (n = 6), strong (n = 8), non-sensitizer (n = 19). D) OpenArray®, 36 stimulations (weak (n = 6), moderate (n = 6), strong (n = 8), non-sensitizer (n = 16).
