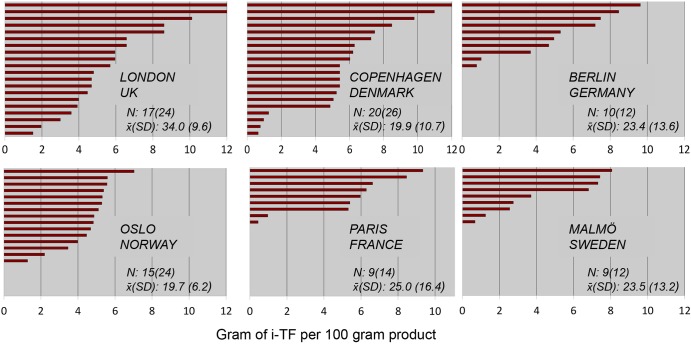
Figure 2.
Amounts of industrially produced artificial trans fat (I-TF) in 100 g of prepackaged biscuits/cakes/wafers with more than 2% I-TF of the total fat content bought in three ethnic shops in five European capitals in 2012–2013 and in Southern Sweden. Each bar in a panel represents a product. N is the number of products. The number in parentheses is the number of foods that fulfilled the inclusion criteria.  (SD) is the mean value of I-TF% of total fat in the products shown in the panel.

