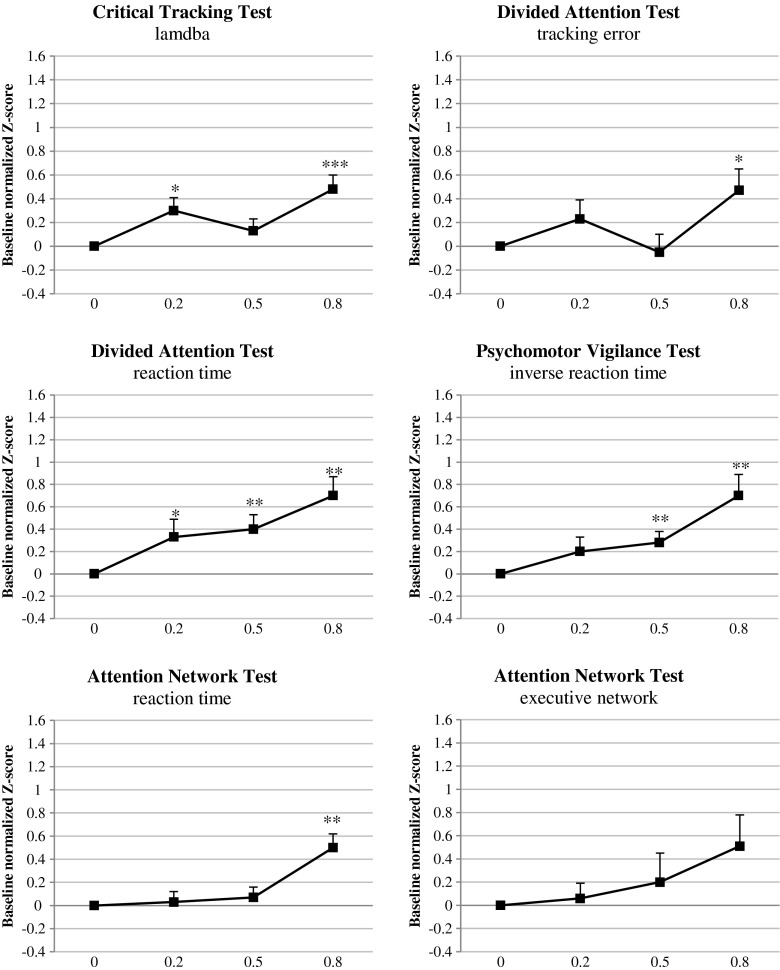
Fig. 3.
Mean baseline normalized performance of BACs 0.2, 0.5, and 0.8 g/L compared with placebo across dependent variables of the Critical Tracking Test, Divided Attention Test, Psychomotor Vigilance Test, and Attention Network Test. *p < 0.05, **p < 0.01, ***p < 0.001. Error bars indicate the standard error of the mean

