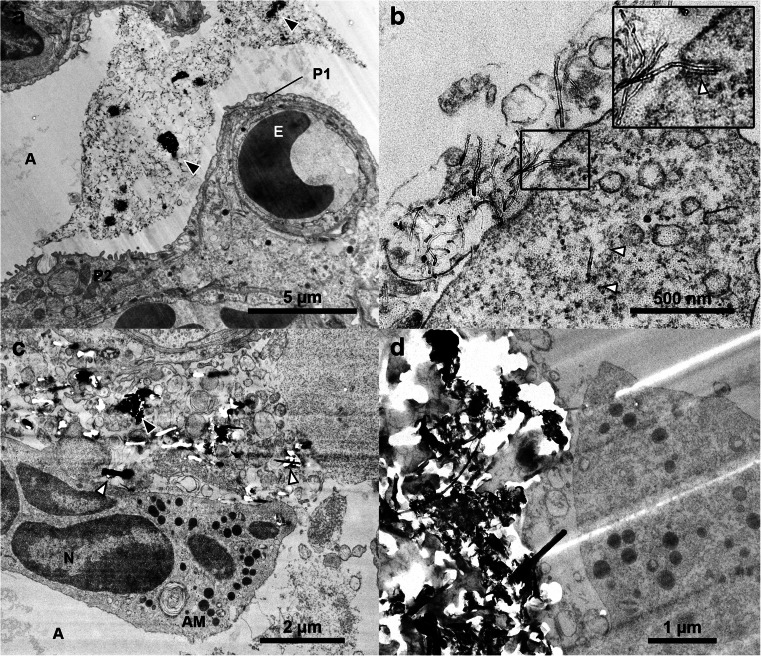
Fig. 3.
TEM micrographs of lung tissue with CNTSmall (a–b) and CNTLarge (c–d). a Overview image of a large agglomeration of CNTSmall in the region where black arrowheads highlight very dense CNT agglomerates in the alveolar lumen. The CNTs are causing minor microtomy artefacts (stripes extending from the middle of the image towards the lower right corner). b A CNTSmall is seen interacting with a cell (insert), and a CNT observed freely inside the cytosol (white arrow). c Overview image showing CNTLarge between cells causing major microtomy artefacts. d TEM image of a dense agglomeration of CNTLarge resulting in holes and stripes in the ultrasection. A alveoli, AM Alveolar macrophage, E erythrocyte, N nucleus, P1 pneumocyte (type 1), and P2 pneumocyte (type 2). Black arrowheads indicate CNT agglomerates, whereas white arrowheads indicate single CNTs

