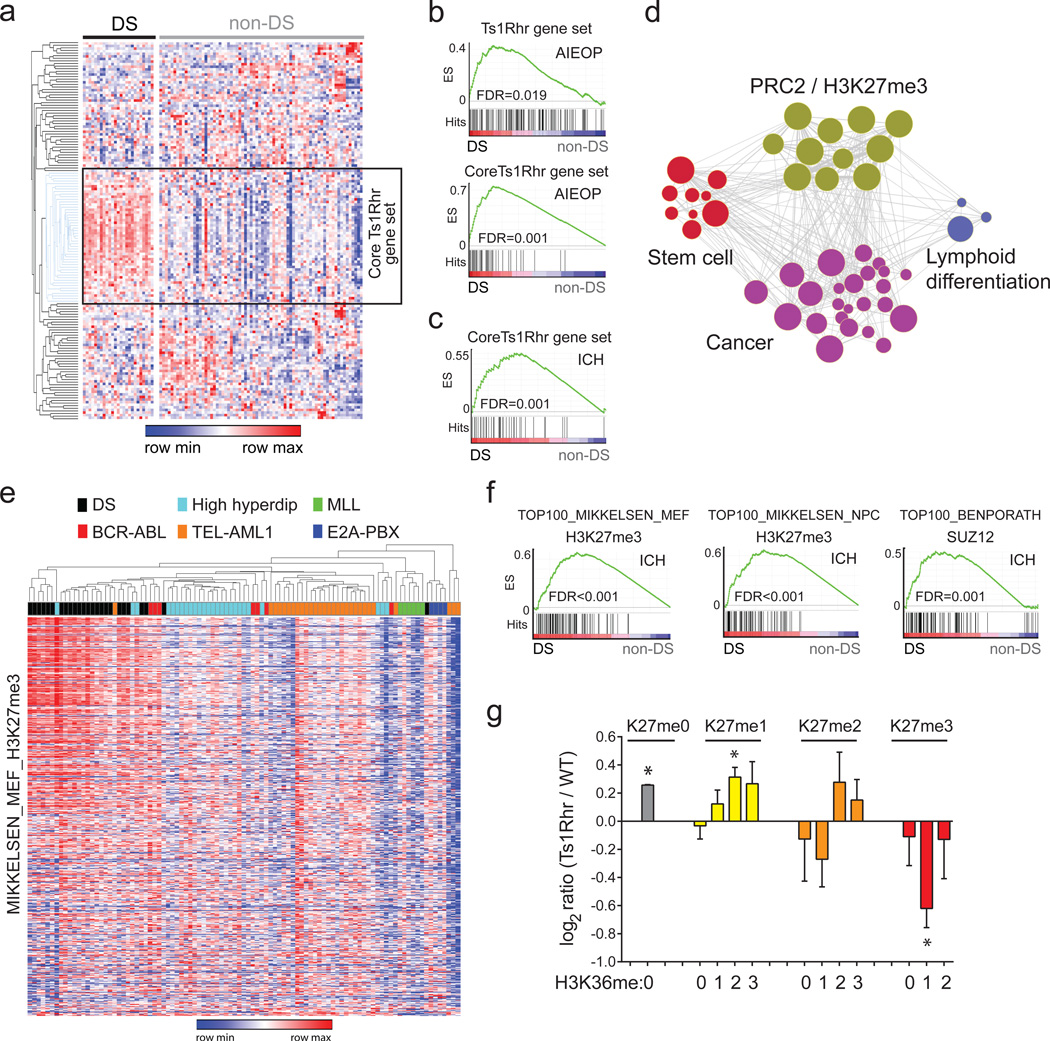
Figure 2. Polysomy 21 B-ALL is associated with the overexpression of PRC2 targets.
(a) Heat map of human genes orthologous to the 150 most upregulated genes from Ts1Rhr B cells in primary human pediatric B-ALLs (“DS-ALL” represents Down syndrome-associated ALL). Unsupervised hierarchical clustering by gene revealed the “core Ts1Rhr” gene set (boxed). (b) GSEA plots for the full and core Ts1Rhr gene sets in the AIEOP data set. ES, enrichment score. (c) GSEA plot of the core Ts1Rhr gene set in an independent ICH validation cohort. (d) Network enrichment map of MSigDB gene sets enriched (FDR<0.05) in the Ts1Rhr expression signature. (e) Unsupervised hierarchical clustering of H3K27me3-marked genes from the MIKKELSEN_MEF_H3K27me3 gene set in the AIEOP pediatric B-ALL cohort (karyotype shown). (f) GSEA plots of the top 100 genes from three PRC2/H3K27me3 gene sets as defined in the AIEOP patient cohort in the ICH validation cohort. (g) Quantitative histone MS for H3K27-K36 peptides (*P<0.05, n=3 samples per group per genotype).

