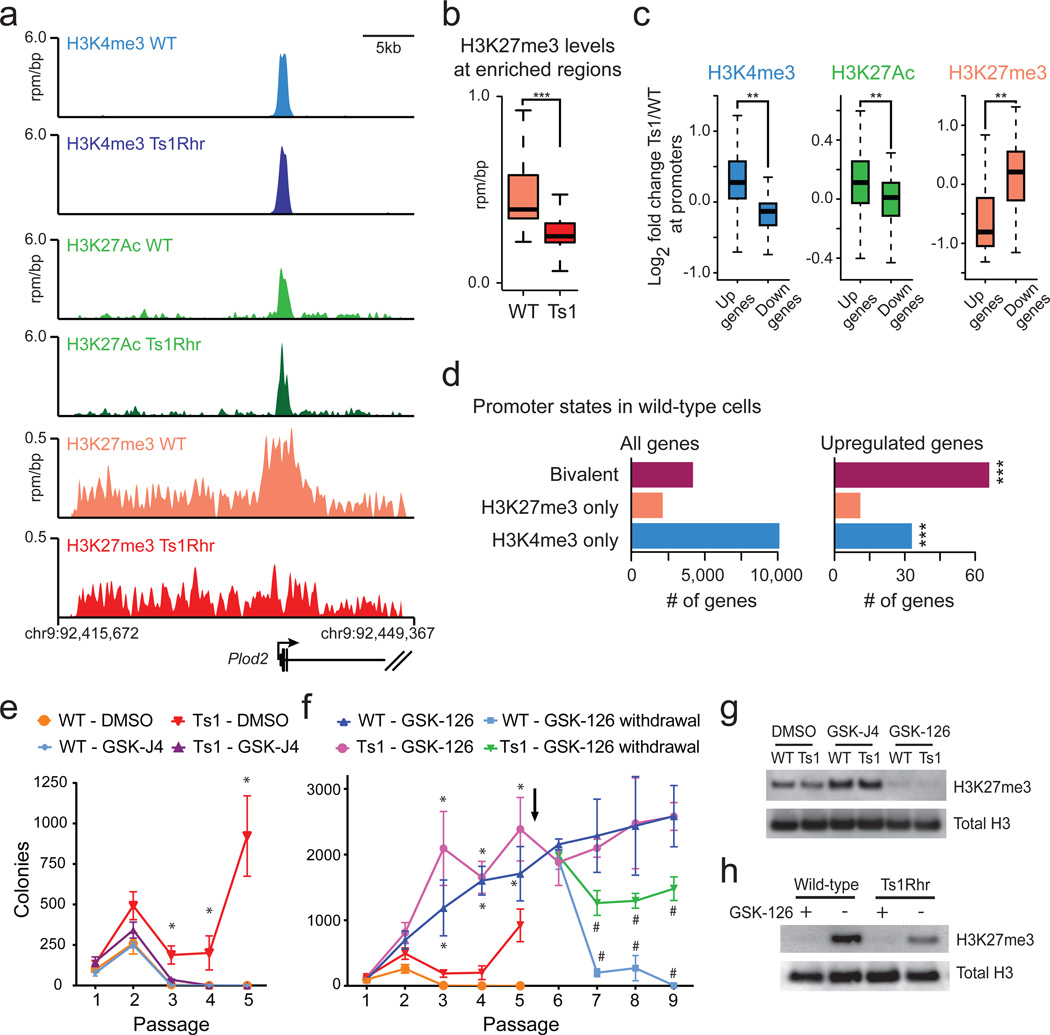
Figure 3. Ts1Rhr B cells have reduced H3K27me3 that results in overexpression of bivalently marked genes.
(a) Gene tracks showing occupancy of histone marks at the Plod2 promoter (one of the 50 core Ts1Rhr genes) in reads per million per base pair (rpm/bp). (b) Levels of H3K27me3 in Ts1Rhr and wild-type B cells at regions enriched for H3K27me3 in wild-type cells (***P<1e-16). (c) Histone marks at the promoters of genes that are upregulated or downregulated in Ts1Rhr vs. wild-type cells (**P< 1e-5). (d) Chromatin marks in wild-type B cells present at promoters of all genes (left) or genes that are upregulated in Ts1Rhr B cells (right, ***P<0.0001 compared to all genes by Chi-square with Yates’ correction). (e) Colony counts in the presence of DMSO or GSK-J4 (n=3–6 biological replicates per genotype, *P<0.05 compared to DMSO for same genotype). (f) Colony counts in the presence of GSK-126 or after withdrawal at passage 5 (*P<0.05 compared to GSK-126 for same genotype, #P<0.05 compared to other genotype or no withdrawal). Arrow indicates GSK-126 withdrawal. (g) Western blotting of passage 2 colonies after 14 total days in culture with DMSO, 1 µM GSK-J4, or 1 µM GSK-126. (h) Western blotting of colonies one passage (7 days) after continuation (+) or removal (−) of GSK-126.

