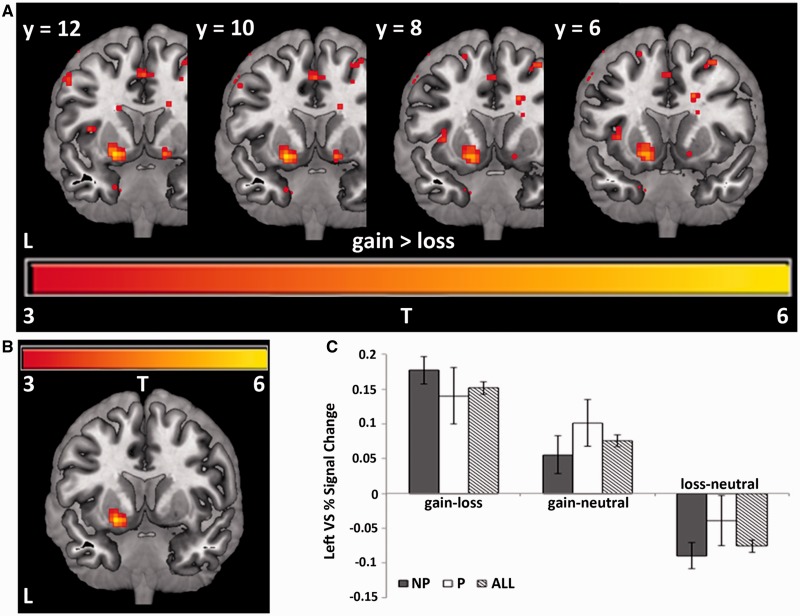
Fig. 1.
(A) Bilateral activation in VS in response to gains relative to losses, displayed at P < 0.005 uncorrected. (B) Activation in left VS in response to gains relative to losses, corrected for multiple comparisons. Peak activation at MNI coordinates: x = −21, y = 9, z = −9; 48 voxels, P < 0.005 uncorrected, α = 0.05. (C) Bar graph showing the average percent signal change across all 48 voxels of the task-activated region of left VS for non-psychopaths (NP), psychopaths (P) and across all subjects (All). Error bars indicate S.E.M.

