Fig. 3.
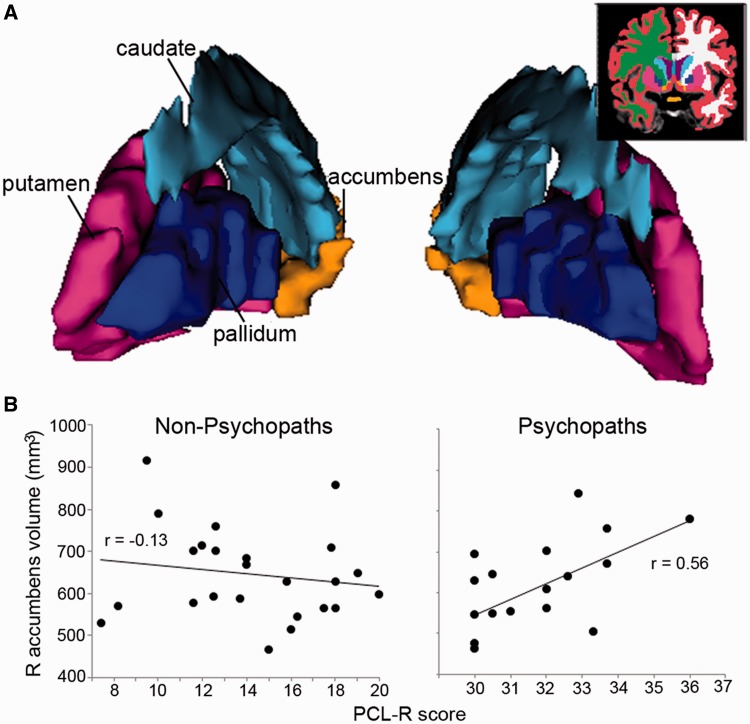
(A) Three-dimensional-rendered striatal subregions of a representative subject. Inset: coronal slice illustrates the segmentation. (B) Correlation of right accumbens area volume (mm3) and PCL-R score. Volume in this region of VS had no correlation with PCL-R score for non-psychopaths (r = −0.13, P = 0.55) but positive correlation with PCL-R score for psychopaths (r = 0.56, P = 0.02). See Supplementary Table S2 for group mean volumes.

