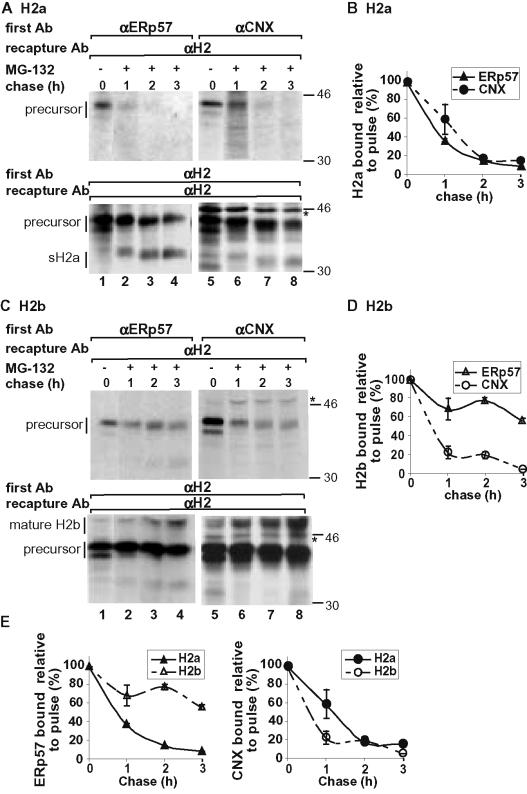
Figure 3.
H2a and H2b show different kinetics of dissociation from ERp57 and CNX. (A) Similar to Figure 2A, except that cells were chased for longer times (as indicated) with complete medium in the presence of 20 μM MG-132. The asterisk indicates a nonspecific band. Indicated on the left are H2a precursor and sH2a, the ectodomain fragment. (B) Average of PhosphorImager quantitations of three experiments similar to the one in A were plotted as in Figure 2B. (C and D) Similar to A and B but with NIH 3T3 cells stably expressing H2b. Indicated on the left are H2b precursor and mature, Golgi-processed H2b. (E) Same values as in B and D were replotted for better comparison of the differences between H2a and H2b in their binding to ERp57 or CNX.

