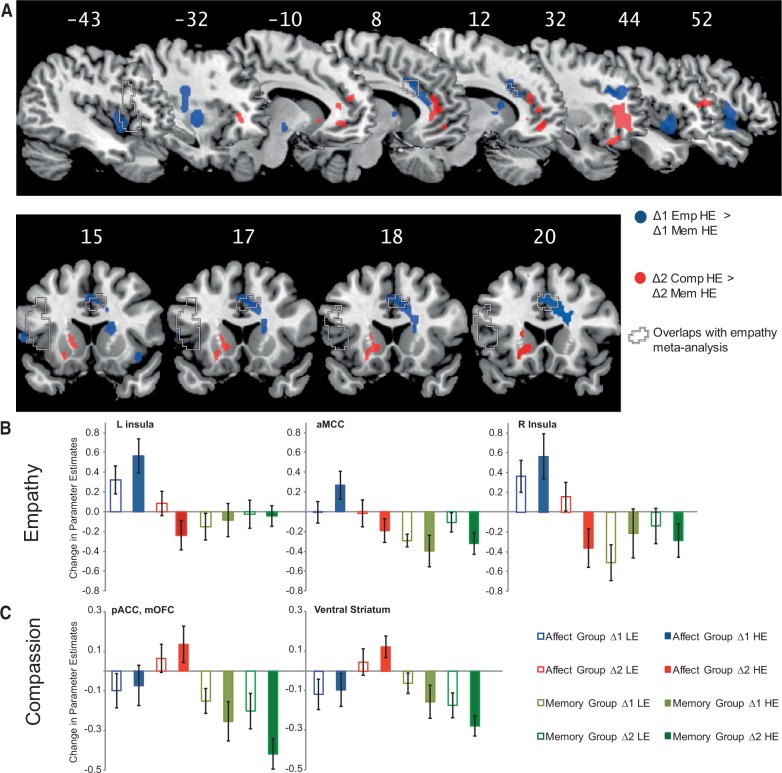
Fig. 3.
(A) Functional neural changes related to empathy (blue) and compassion training (red) in comparison with the memory control group (P < 0.05, FWE corrected). Regions in which changes related to empathy training overlap with a recent empathy for pain meta-analysis (Lamm et al., 2011) are indicated by dashed lines. (B) Bar charts of changes in parameter estimates in the areas related to empathy training (Empathy Δ1 HE > Memory Δ1 HE). (C) Bar charts of changes in parameter estimates of the areas related to compassion training (Compassion Δ2 HE > Memory Δ2 HE). The values represent the mean activation of all voxels in one cluster; error bars depict standard error of mean.

